


Join Our Telegram channel to stay up to date on breaking news coverage
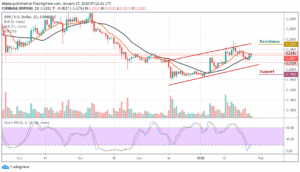
XRP Price Prediction – January 27
XRP/USD is vulnerable to further losses as long as the technical indicator stays within the oversold territory.
XRP/USD Market
Key Levels:
Resistance levels: $0.25, $0.26, $0.27
Support levels: $0.19, $0.18, $0.17
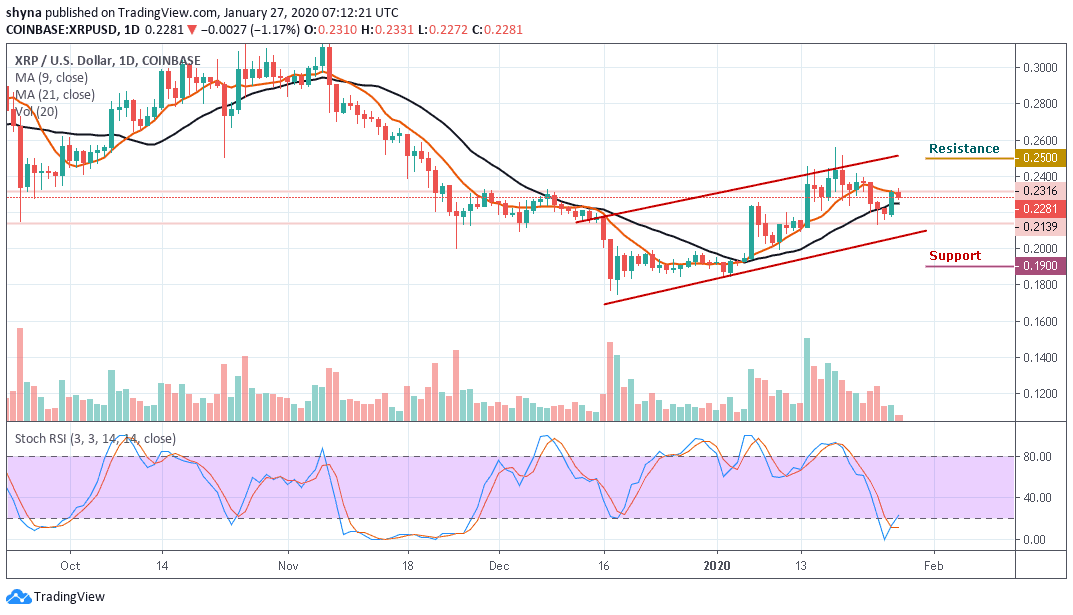
Last week, Ripple’s XRP bottomed at $0.213 but has now recovered to $0.228 by the time of writing. Compared to yesterday’s trading, XRP/USD has is down with 1.17% as the market opens today. Although, the current movement is still around the 9-day and above the 21-day moving averages, if the bulls can manage to engineer a sustainable recovery above this handle, the short-term movement will improve slightly, while the coin will get a chance for an upside move towards $0.24.
Looking at the chart technically, XRP may likely experience more losses as long as the technical indicator stays within the oversold zone. Ripple has recently crossed below the $0.230 level which has contributed to the downward movement. It has been over a week since the price to buy Ripple maintained a bullish sentiment and stood at least above $0.235. Over the past few days, the price of the XRP has collapsed to trade regularly below $0.230 level, but apparently, there is still no price surge against the US dollar.
Moreover, the daily chart has revealed that the buyers are still dominating the market as they maintained the upward movement. For now, the key support level to watch out for lies at $0.19 and $0.18. A further drop may slip price to $0.17 support level. For a retracement move, the $0.24 level is likely to resurface before the rally continues. If the $0.24 could now contain the retracement, the price may further swing to $0.25, $0.26 and $0.27 resistance levels. The stochastic RSI is within the overbought zone, indicating a bearish signal.
When compared with BTC, the Ripple price has been ranging and trading within the channel since December 19, 2019. At the moment, XRP/BTC is changing hands at 2644 SAT which is within the 9-day and 21-day moving averages. Looking at the daily chart, the market may likely follow the downward trend as the technical indicator RSI (14) nosedives below 45-level, suggesting more bearish signals.
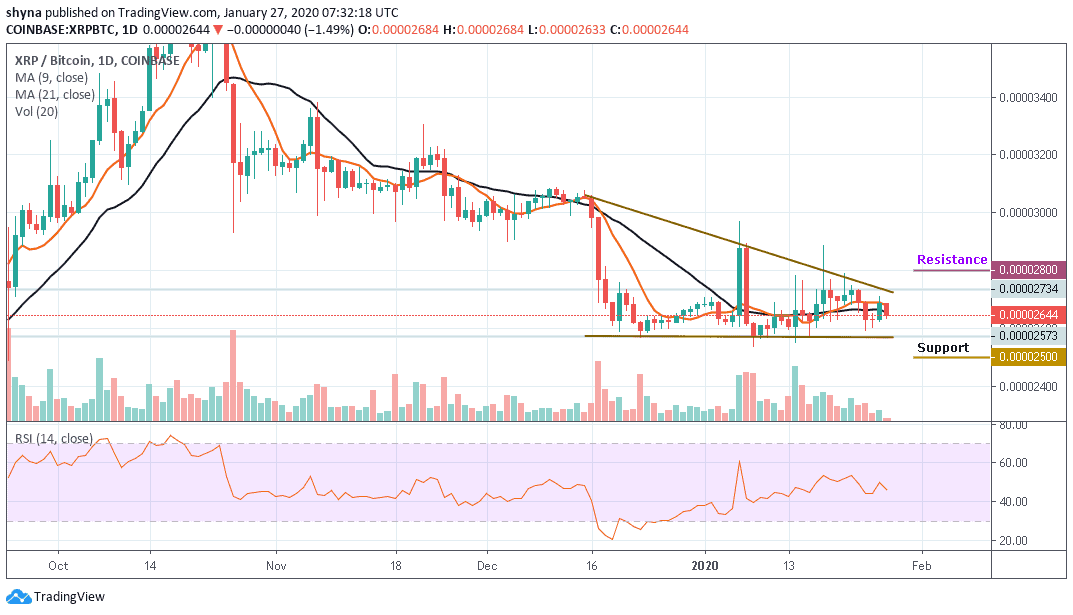
However, if the market could fall below the moving averages, the next key supports of 2500 SAT and below may be visited. Nevertheless, on the bullish side, a possible rise above the moving averages may likely push the price above the upper boundary of the symmetric triangle and could reach the resistance levels of 2800 SAT and 2900 SAT respectively.
Please note: Insidebitcoins.com is not a financial advisor. Do your research before investing your funds in any financial asset or presented product or event. We are not responsible for your investing results.
Join Our Telegram channel to stay up to date on breaking news coverage
