Join Our Telegram channel to stay up to date on breaking news coverage
Ripple Price Prediction – December 10
As the market opens today, the Ripple price is seen dropping from $0.90 to touch the low of $0.80 and this followed a bearish movement of yesterday.
XRP/USD Market
Key Levels:
Resistance levels: $1.00, $1.05, $1.10
Support levels: $0.70, $0.65, $0.60

Touching the low of $0.80 today, XRP/USD may continue to show weakness in price until the market finds a stable level to reinforce a bullish-run. For now, a new low is yet to be ascertained as bears remain dominant and active over the past few days. Traders may need to wait for the sellers to exhaust momentum before longing and shorting Ripple (XRP) might be the best position for now.
Ripple Price Prediction: Ripple (XRP) May Stay at the Downside
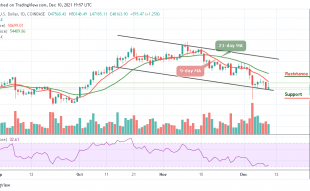
As the Ripple price moves downward, if the market eventually crosses below the lower boundary of the channel, XRP/USD may remain at the downside, if this persists, before the Ripple (XRP) create another low, it could find immediate support at $0.75 while the critical supports could be located at $0.70, $0.65 and $0.60. Moreover, the Ripple (XRP) has continues to move bearishly on the daily chart.
Looking at the daily chart, a bullish rally may confirm if the market can climb significantly above the 9-day and 21-day moving averages to touch the nearest resistance level at $0.96. Meanwhile, the technical indicator Relative Strength Index (14) is currently moving below 40-level. Therefore, if the Ripple price manages to surge above $0.95, it may see the resistance levels at $1.00, $1.05, and $1.10.
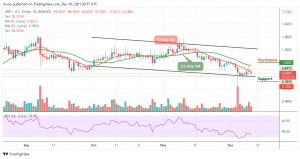
Against Bitcoin, the pair is consolidating within the channel as the coin is likely to cross below the 9-day and 21-day moving averages. However, the buyers are making effort to push the price upward so that the bullish continuation may take it above the upper boundary of the channel to hit the resistance level of 1900 SAT and above.
Moreover, if the bulls couldn’t push the price upward, the Ripple price may continue to drop lower and the nearest support level to be reached is 1600 SAT and below. However, the technical indicator Relative Strength Index (14) nosedives below 50-level, suggesting a bearish movement for the coin.
Looking to buy or trade Ripple (XRP) now? Invest at eToro!
68% of retail investor accounts lose money when trading CFDs with this provider
Join Our Telegram channel to stay up to date on breaking news coverage