Join Our Telegram channel to stay up to date on breaking news coverage
XRP Price Prediction – November 27
Ripple (XRP) may be able to go higher as the technical indicators start to flatten out in oversold conditions.
XRP/USD Market
Key Levels:
Resistance levels: $0.25, $0.27, $0.29
Support levels: $0.19, $0.17, $0.15
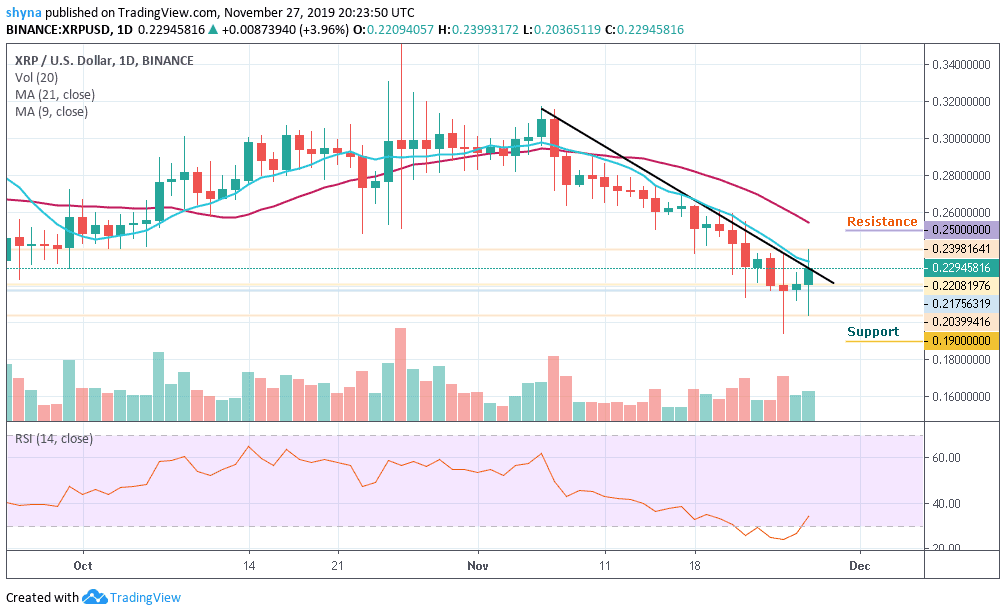
The daily chart above shows XRP/USD bouncing from the strong support at $0.217 over the past three days. Like the majority of the altcoins market, XRP suffered heavily in November after dropping by a total of 25% to create a multi-year low, not seen since two years ago. Nevertheless, the support at $0.217 looks to be strong, and it’s interesting to see if XRP/USD will start to rebound higher from here.
Looking at the daily chart, Ripple is once again at the helm of the recovery of the cryptocurrency market. The third-largest cryptocurrency in the world is up more than 1% in the context of large-scale consolidation. The bullish action from the opening price of $0.220 has eyes on $0.235 but has climbed to highs around $0.229. The volatility increases along with the uptrend.
More so, a significant cross above the trend line and the 9-day moving average could sustain the bulls to $0.23 and $0.24 highs. If XRP/USD manages to surge above $0.24 as the RSI (14) is moving out of the oversold zone, it may see resistance at $0.25, $0.27 and $0.29, though a further drop could lower it to the support levels of $0.19, $0.17 and $0.15.
Against Bitcoin, the pair is consolidating within the channel and moving below the 9-day and 21-day moving averages. Meanwhile, the sellers are trying to push the price below the lower boundary of the channel and the bearish continuation may take it to the support levels of 2900 SAT and 2800 SAT respectively.
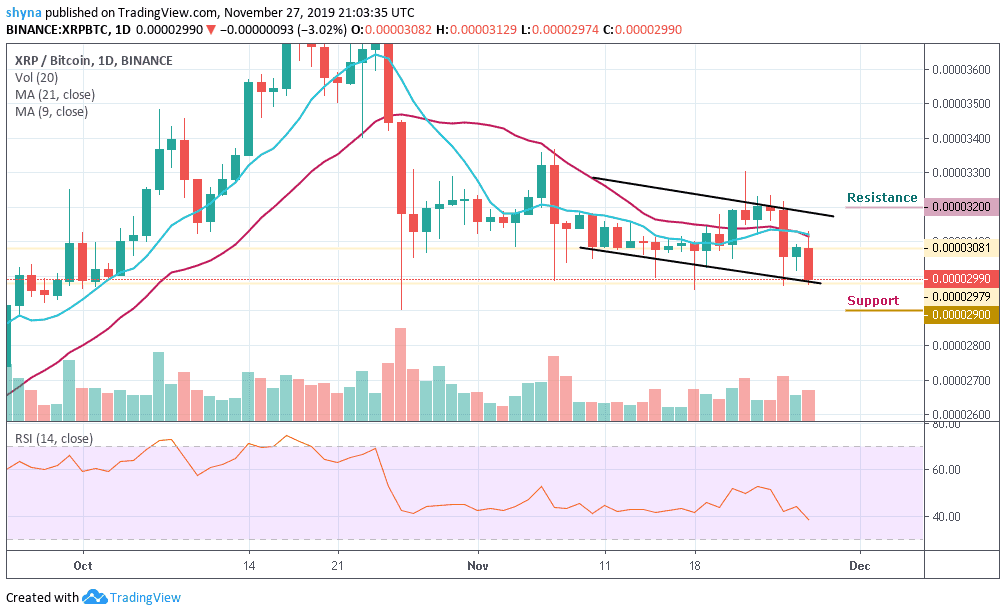
Moreover, looking at the chart, if the bulls can hold the price as it is now, then the Ripple (XRP) may likely rise above the channel and the nearest resistance levels for the coin are 3200 SAT and 3300 SAT. The RSI (14) moves below level 40, which may likely give bearish signals.
Please note: Insidebitcoins.com is not a financial advisor. Do your research before investing your funds in any financial asset or presented product or event. We are not responsible for your investing results.
Join Our Telegram channel to stay up to date on breaking news coverage