Join Our Telegram channel to stay up to date on breaking news coverage
XRP Price Prediction – December 23
Ripple (XRP) rebounded at the $0.18 support last week but failed to climb above the resistance at $0.20.
XRP/USD Market
Key Levels:
Resistance levels: $0.220, $0.230, $0.240
Support levels: $0.170, $0.160, $0.150
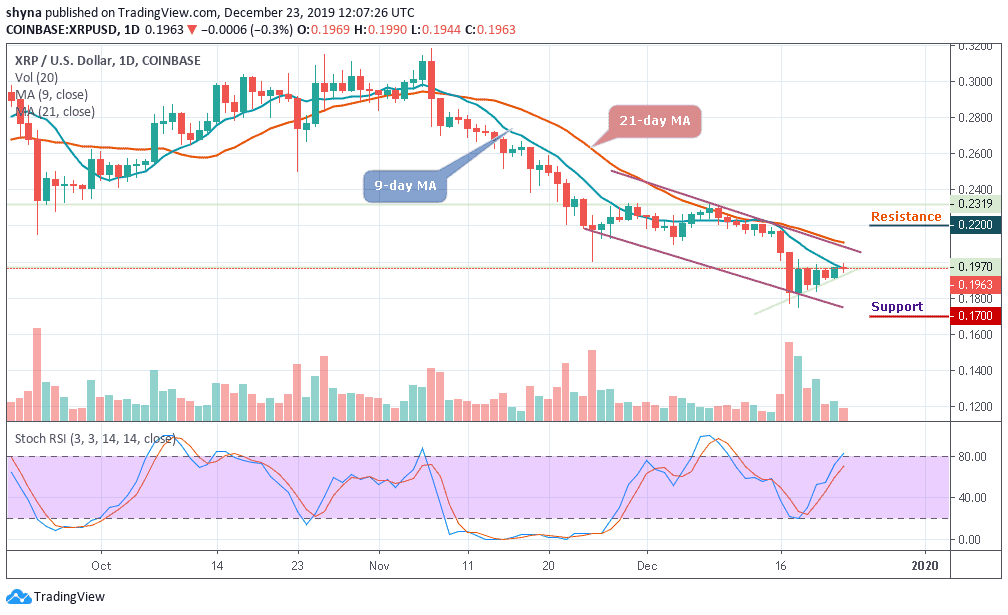
The daily chart shows XRP/USD rebounding from the support at $0.187, allowing it to climb higher towards $0.20. However, Ripple (XRP) has been struggling to break above $0.20, leading the cryptocurrency to trade sideways during the last few days. The Ripple coin remains the 3rd largest crypto with a total market cap value of $9.87 billion.
However, if XRP were to reverse and drop beneath the support at $0.180 which is below the 9-day and 21-day moving averages, it could turn strongly bearish again. Meanwhile, for the cryptocurrency to become bullish, it must break above $0.20 and continue to create a fresh high above the December high at $0.231.
Conversely, if the price drops below the $0.180 support level, the pair may likely locate the $0.170 support, which is the close support level for the bears and a bearish continuation could bring the market to the critical supports at $0.160 and $0.150 respectively. On the upside, should the bulls decide to move the price upward, it could break out of the channel to meet the potential resistance at $0.220, $0.230 and $0.240.
Meanwhile, the stochastic RSI faces upward, hoping to cross into the overbought zone which may likely boost the upward movement for a while.
Against Bitcoin, the trend of the pair is still perpetually looking bearish in the long-term, priced at around 2595 SAT. Meanwhile, the 3rd largest cryptocurrency is witnessing different trends against USD and this bearish continuation may likely take the price to the support levels at 2400 SAT and 2200 SAT if broken the lower boundary of the descending channel.
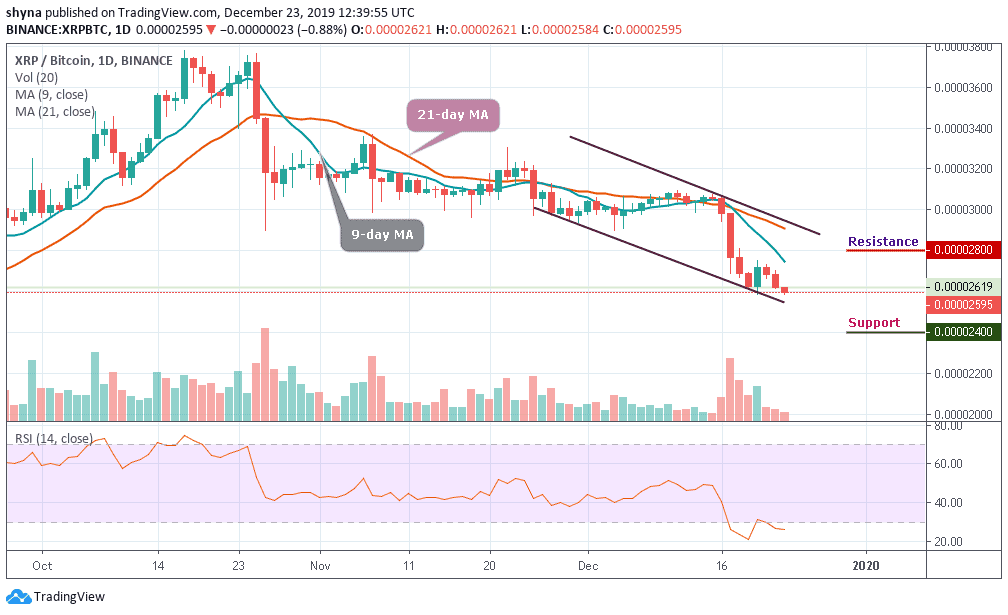
However, if the bulls could hold the current price, we can expect the coin to rise toward the moving averages of 9 and 21 days. For now, the nearest resistance levels for the market lie at 2800 SAT and 3000 SAT. Whereas, the RSI (14) indicator is still moving within the oversold zone, which indicates more bearish signals may play out.
Please note: Insidebitcoins.com is not a financial advisor. Do your research before investing your funds in any financial asset or presented product or event. We are not responsible for your investing results.
Join Our Telegram channel to stay up to date on breaking news coverage