Join Our Telegram channel to stay up to date on breaking news coverage
XRP Price Prediction – December 26
XRP/USD is floating within the channel as the price is struggling to break above the trend line.
XRP/USD Market
Key Levels:
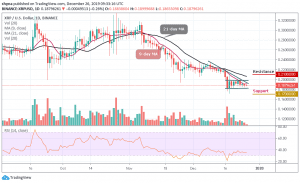
Resistance levels: $0.210, $0.220, $0.230
Support levels: $0.170, $0.160, $0.150
Earlier today, the price of XRP/USD has gone up from $0.188 to $0.191 before giving a bearish signal as at the time of writing, the coin is also floating within the middle of the channel as the RSI (14) indicator moves in the same direction. The daily breakdown shows that the intraday support and resistance lie between $0.198 and $0.182 respectively.
Moreover, the Ripple price has continued to demonstrate a sign of weakness across its markets. Now, the XRP/USD market is down by 0.26%, reflecting a price drop in the market trading below the 9-day and 21-day moving averages and the fall might become heavy if the bearish action continues. Meanwhile, around eight days ago, the third largest-cryptocurrency has witnessed a bullish drive against USD.
Therefore, since the XRP/USD is moving in sideways, the trend may likely advance higher if the current price holds and remain inside the channel. A channel breakout could strengthen the bulls and push the price to the resistance levels of $0.210, $0.220 and $0.230 whereas a channel breakdown might lead the market in a bearish scenario if the price continues to fades and the closest supports to reach are $0.170, $0.160, and critically $0.150.
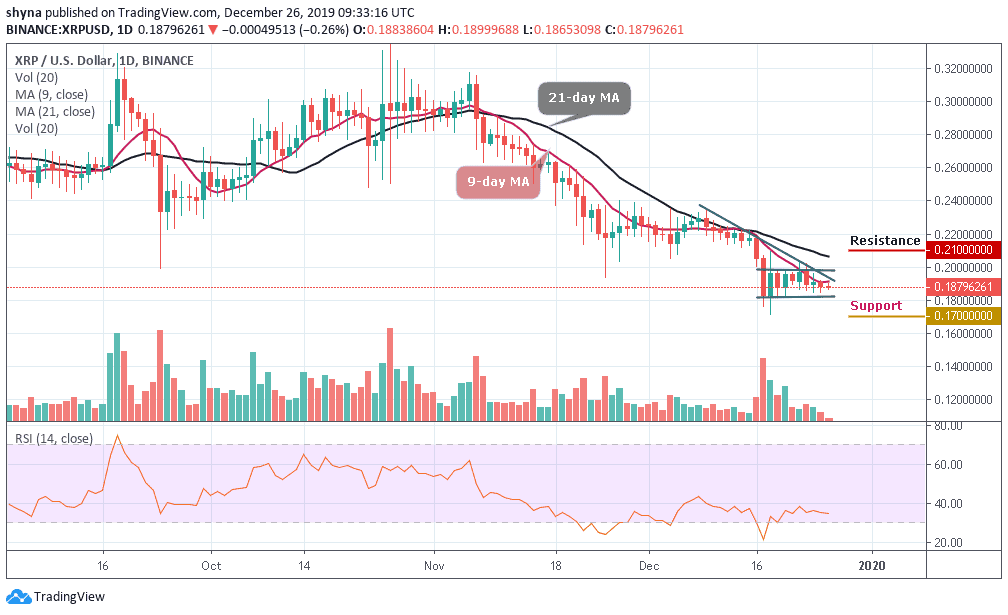
When compared with Bitcoin, the pair is consolidating within the channel and moving below the 9-day moving average. Meanwhile, the buyers are making effort to push the price above the moving average of which the bullish continuation may likely take it to the resistance levels of 2800 SAT and 2900 SAT respectively.
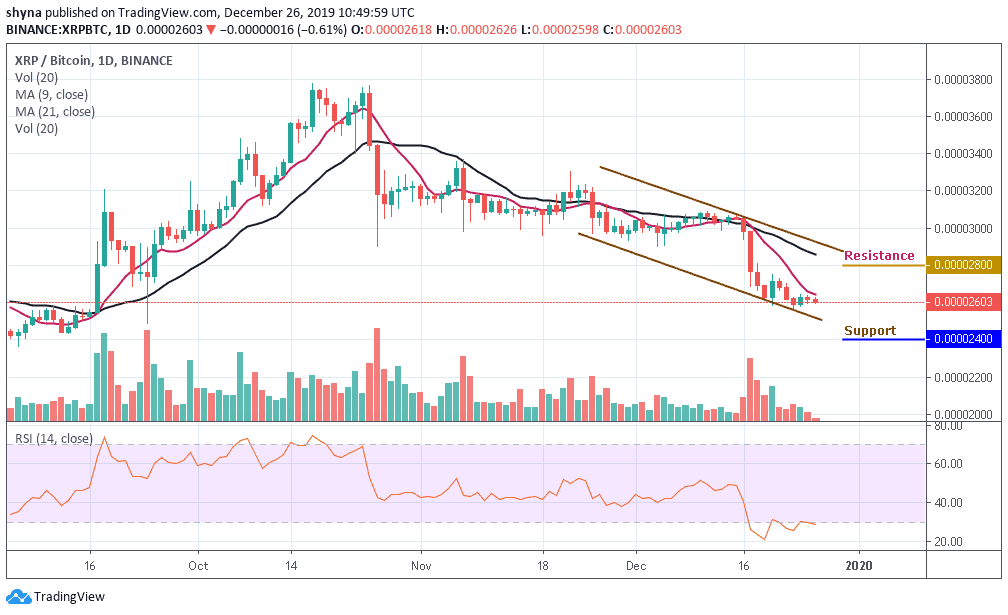
Looking at the daily chart, should the bulls failed to hold the price, then it may likely fall below the channel and the nearest support levels for the coin are 2400 SAT and 2300 SAT. The RSI (14) moves at the tip of the oversold zone, which indicates some sideways movement.
Please note: Insidebitcoins.com is not a financial advisor. Do your research before investing your funds in any financial asset or presented product or event. We are not responsible for your investing results.
Join Our Telegram channel to stay up to date on breaking news coverage