Join Our Telegram channel to stay up to date on breaking news coverage
XRP Price Prediction – November 17
If Ripple’s XRP manages to climb above the $0.270, the market may fuel a bull run to $0.300 resistance level and above.
XRP/USD Market
Key Levels:
Resistance levels: $0.285, $0.300, $0.315
Support levels: $0.235, $0.230, $0.225

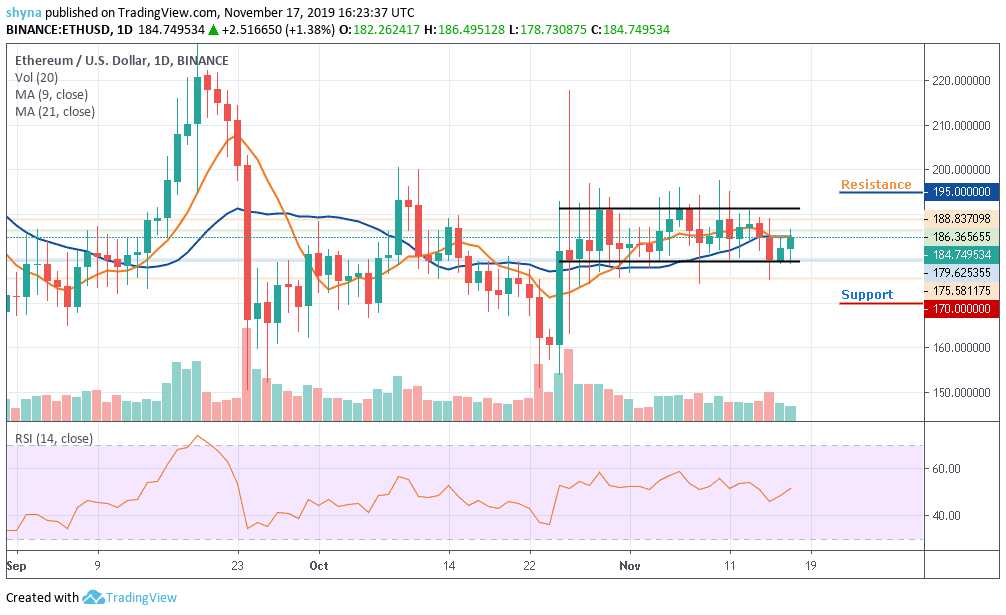
The Ripple (XRP) price is currently trading around the $0.263 support level and it may continue to decline if the buyers couldn’t hold the current market price. A few days ago, the recent downtrend pushed the price below the $0.260 support level and a new monthly low was formed near the $0.251 support level.
At the time of writing this article, XRP/USD price continues to show a strong downtrend on the chart, as well as a decreasing trend line that has served as a diagonal resistance for the market since November 7. Since then, the market couldn’t recover from the sell-off as the price action now seeks for a retest at the $0.240 resistance level before returning to support levels of $0.235, $0.230 and $0.225.
However, if Ripple’s XRP manages to climb above the $0.270, the market may fuel a bull run to $0.285, $0.300, $0.315 resistance levels and above. As of now, the bulls appeared to be stepping back into the market on a long-term outlook. Here’s a look at what is coming at to the different cryptocurrency exchanges in September 2020, and what’s really the forex brokers fee will be .Therefore, it might be so difficult for the buyers to move the market to the north until they are able to push the price above the 9-day and 21-day moving averages. The RSI (14) is moving below level 40, which shows that the market is still down.
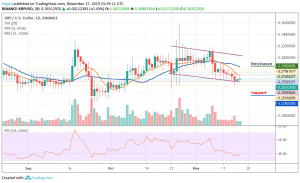
When compared with Bitcoin, the Ripple (XRP) moves in sideways as the price trades below the 9-day and 21-day moving averages. Now, the bear appears to be stepping back in the market, and we may expect the price-drop to 2850 SAT and 2750 SAT support levels. But as at the time of writing, XRP/BTC is changing hands at 3093 SAT.
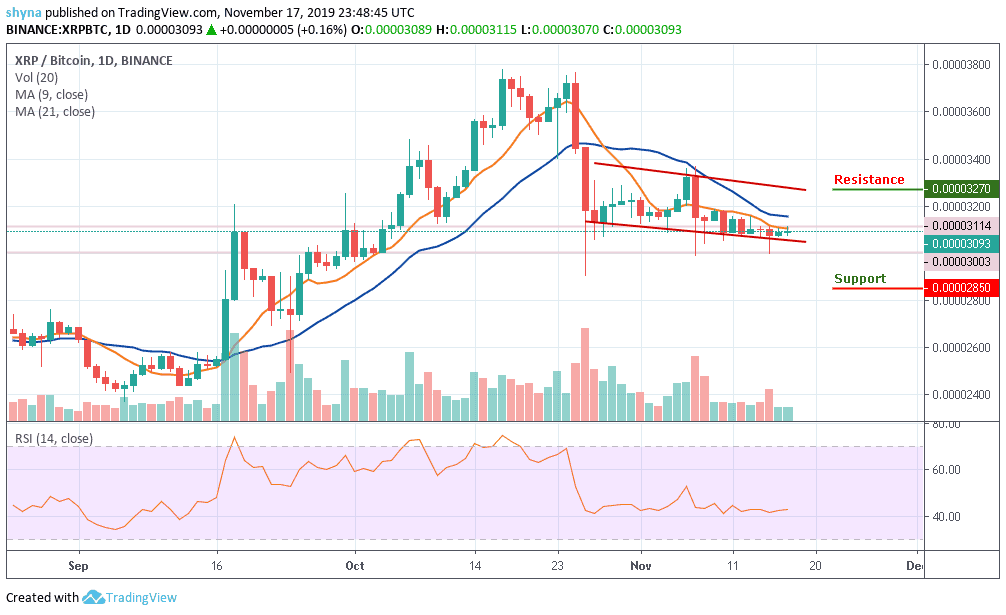
Nevertheless, if the buyers push the price above the current 3093 SAT, the next level of resistance is located at 3200 SAT and more resistance is found at 3270 SAT and 3370 SAT. The RSI (14) moves in the same direction as the market is indecisive for now.
Please note: Insidebitcoins.com is not a financial advisor. Do your research before investing your funds in any financial asset or presented product or event. We are not responsible for your investing results.
Join Our Telegram channel to stay up to date on breaking news coverage