Join Our Telegram channel to stay up to date on breaking news coverage
XRP Price Prediction – March 7
XRP/USD dropped a bit from $0.245 to $0.237 and this followed a bullish Friday where the price went up from $0.238 to $0.245.
XRP/USD Market
Key Levels:
Resistance levels: $0.280, $0.300, $0.320
Support levels: $0.200, $0.180, $0.160
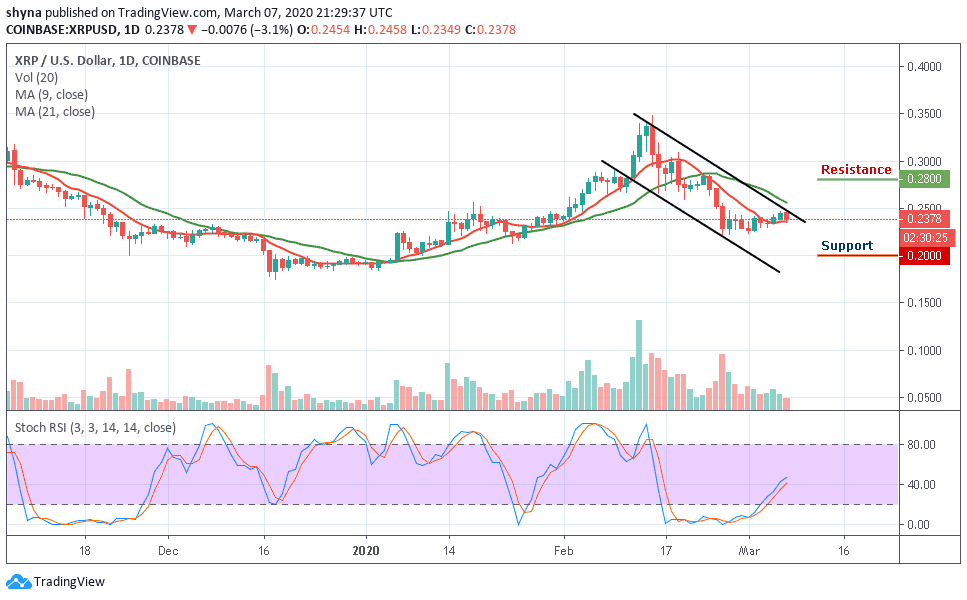
Having slumped beneath the $0.240, XRP/USD may continue to show weakness in price and fall at support until the market may find a stable level to reinforce bullish run. For now, a new low is yet to be ascertained as the bears remain dominant and active over the past days. We may need to wait for the sellers to exhaust momentum before longing. However, shorting XRP might be the best position for now.
However, if the market eventually resumes sell-off now, the market may cross below the 9-day moving average and could find immediate support at $0.220 and $0.210 while the critical supports lie at $0.200, $0.180 and $0.160. However, the XRP/USD pair has continued to erode bearishly on the daily time frame.
In other words, a bullish rally will only confirm if the market can climb significantly back above the $0.260. Meanwhile, the stochastic RSI has produced a bullish crossover from the oversold condition. If XRP manages to surge above $0.270, it may see the resistance levels at $0.280, $0.230 and $0.232.
Against Bitcoin, the pair is consolidating within the channel and now moving below the 9-day and 21-day moving averages. Meanwhile, the buyers are making effort to push the coin to the north so that the bullish continuation may take it to the resistance levels of 3000 SAT and 3200 SAT respectively.
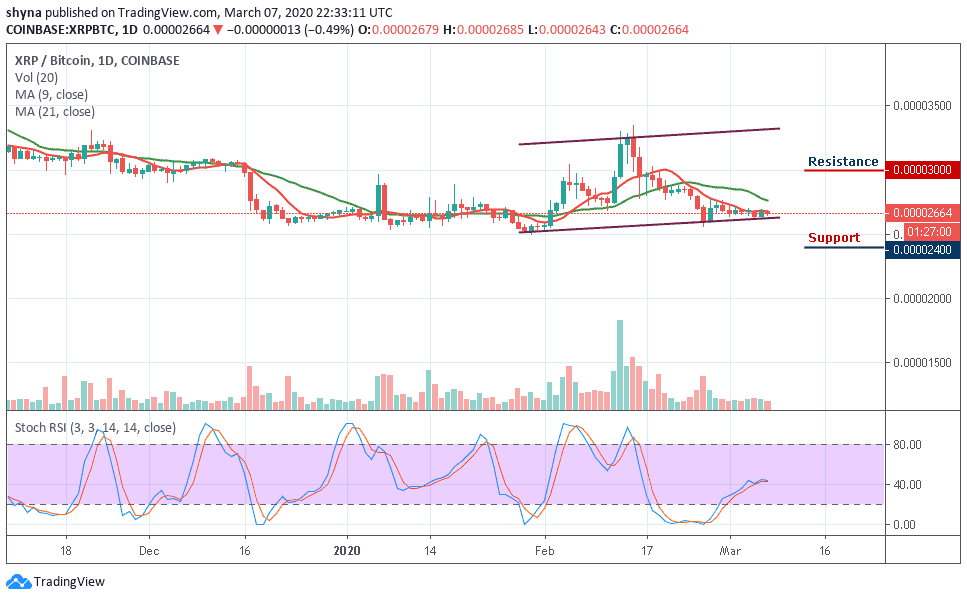
Conversely, if the bulls failed to hold the price, then it may continue to fall towards the lower boundary of the channel and the nearest support levels to be met are 2400 SAT and 2200 SAT. Moreover, the stochastic RSI moves above 40-level, which indicates an upward movement.
Please note: Insidebitcoins.com is not a financial advisor. Do your research before investing your funds in any financial asset or presented product or event. We are not responsible for your investing results.
Join Our Telegram channel to stay up to date on breaking news coverage