Join Our Telegram channel to stay up to date on breaking news coverage
The Ripple price prediction is down by 0.02% in the last few hours as the current market value may go below $0.40.
Ripple Prediction Statistics Data:
- Ripple price now – $0.41
- Ripple market cap – $19.8 billion
- Ripple circulating supply – 48.3 billion
- Ripple total supply – 99.9 billion
- Ripple Coinmarketcap ranking – #6
XRP/USD Market
Key Levels:
Resistance levels: $0.55, $0.60, $0.65
Support levels: $0.25, $0.20, $0.15
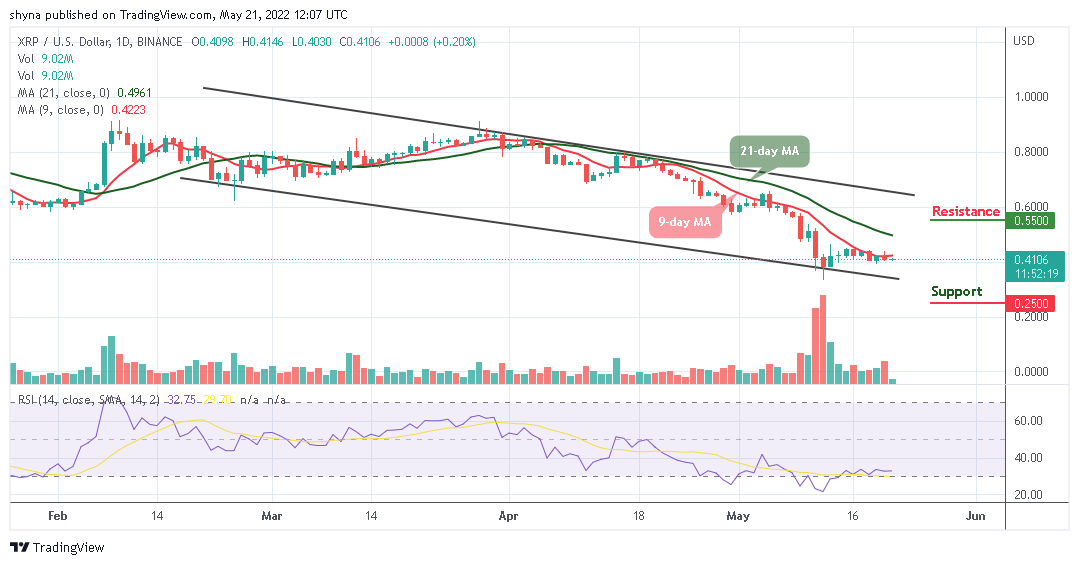
XRP/USD begins today’s trade at $0.40 below the 9-day moving average and the coin is likely to slide below this level and face the south. However, the Ripple price is trading at the downside while the Relative Strength Index (14) may move to cross into the oversold region. Nevertheless, any bearish move below this barrier may give the market enough strength to dig a dip, but crossing above the 9-day moving average may lead the market to the upside.
Ripple Price Prediction: XRP/USD Remains at the Downside
The Ripple price is showing a sign of weakness across its markets as the coin gains 0.20%, reflecting a slight price rise in the market. Therefore, since the Ripple price is moving sideways, traders can expect the trend to keep moving lower if the price action crosses below the lower boundary of the channel.
However, any bullish movement above the moving averages could strengthen the bulls and push the price to the resistance levels of $0.55, $0.60, and $0.65, but a breakdown might lead the market to a bearish scenario where the price may likely reach the supports at $0.25, $0.20, and $0.15.
When compared with Bitcoin, the Ripple price is hovering below the 9-day and 21-day moving averages. Therefore, if the bears put more effort, XRP/BTC may create a new low by touching the nearest support at 1300 SAT. Now, the technical indicator Relative Strength Index (14) moves below the 40-level; traders may continue to see a negative move within the channel if crosses below the lower boundary of the channel.
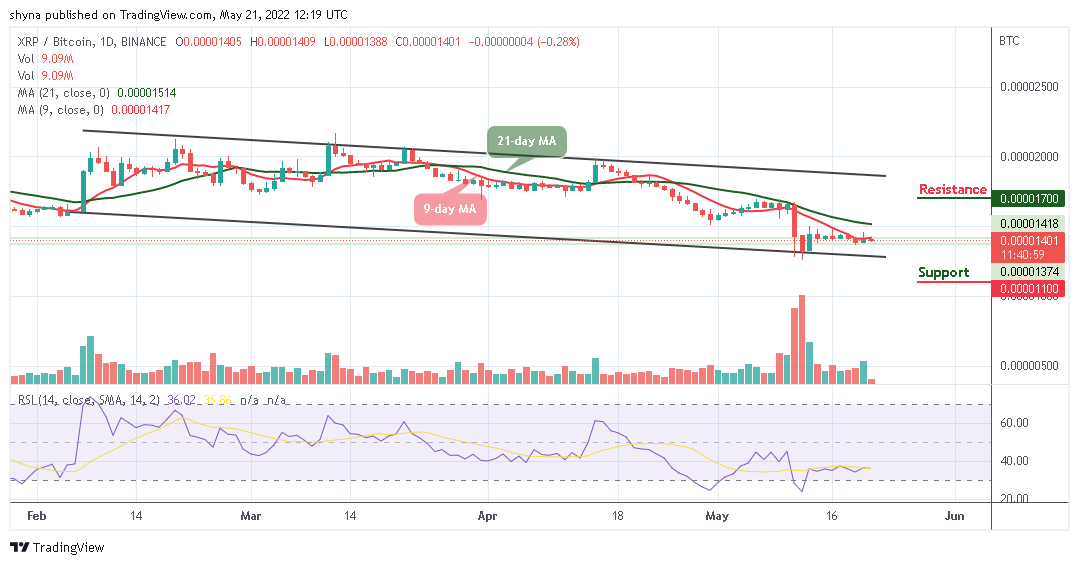
However, the Ripple (XRP) is currently changing at 1401 SAT, therefore, if the coin drops below the current value, the market may experience close support at 1200 SAT before breaking to 1100 SAT and below. Nevertheless, if the Ripple price moves and crosses above the 9-day and 21-day moving averages; traders can confirm a bull run for the market, and the nearest resistance level could be located at 1700 SAT and above.
Looking to buy or trade Ripple (XRP) now? Invest at eToro!
68% of retail investor accounts lose money when trading CFDs with this provider
Join Our Telegram channel to stay up to date on breaking news coverage