Join Our Telegram channel to stay up to date on breaking news coverage
XRP Price Prediction – February 8
Ripple price is facing a downward trend, moving below the $0.280 resistance against the US dollar.
XRP/USD Market
Key Levels:
Resistance levels: $0.310, $0.320, $0.330
Support levels: $0.250, $0.240, $0.230
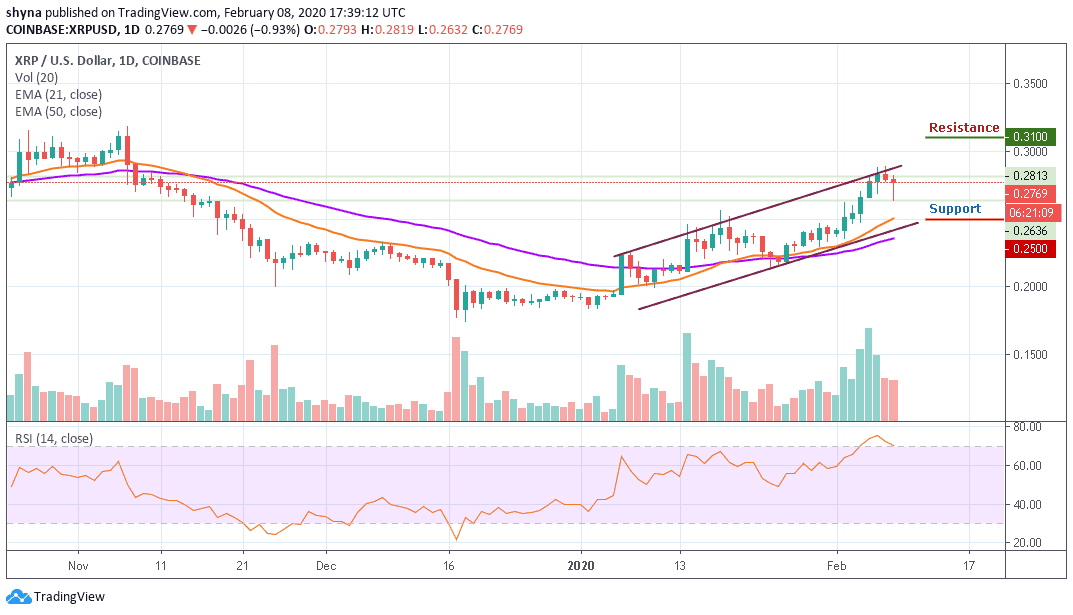
XRP/USD is slowly declining below the key supports. The coin might revisit the $0.270 support before it could start a new increase. After struggling to stay above $0.288, Ripple (XRP) started a slow and steady decline. The coin traded below the key $0.277 support area to move into a short term bearish zone.
Moreover, the pair is currently exchanging hands at $0.276 and any attempt to make it cross below the 21 periods EMA may likely open the doors for more downsides and the price could spike below the $0.275 support level. However, we should keep an eye on the $0.270 and $0.265 before creating a new bullish trend at the resistance levels of $0.310, $0.320 and $0.330.
Furthermore, we may experience a quick buy once the trade reaches the support at $0.260. And if the price fails to rebound, then a bearish breakout is likely to trigger more selling opportunity for traders, which might cause the price to retest $0.250 and could further drop to $0.240 and $0.230 support levels respectively. The RSI (14) is about recovering from the overbought zone. If the price moves downward, Ripple (XRP) may fall more.
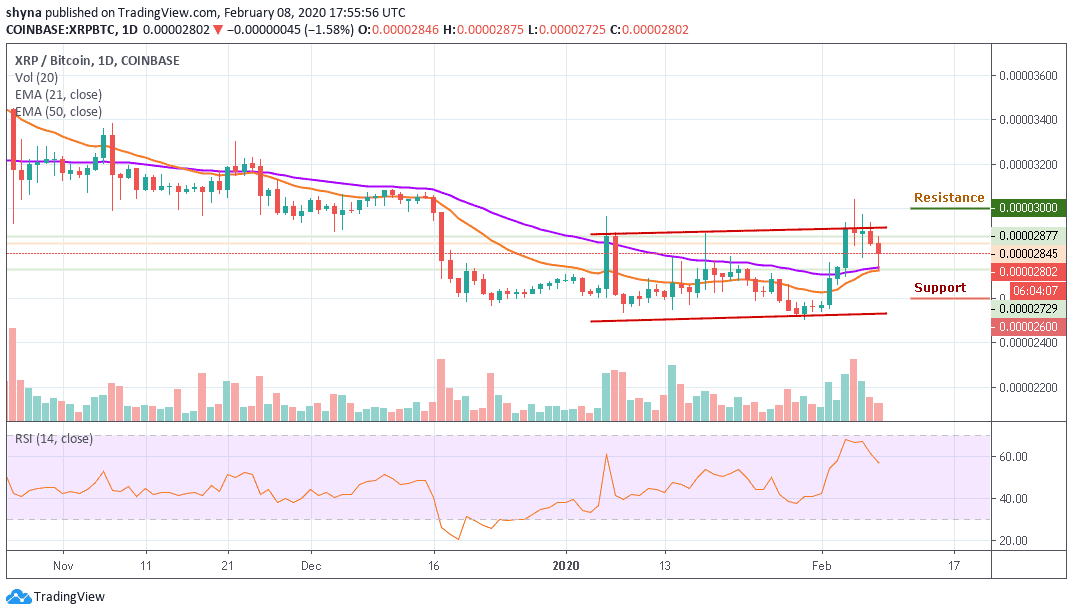
When compared with BTC, the pair is consolidating within the channel and moving towards the 21 and 50 periods EMA. Meanwhile, should in case a rebound comes to play, the coin may face the upward trend and the bullish continuation may take it to the resistance levels of 3000 SAT and 3100 SAT respectively.
Looking at the daily chart, if the bulls failed to hold the selling pressure, then the pair may likely fall below the channel and the nearest support levels for the coin are 2600 SAT and 2500 SAT. The RSI (14) moves below 60-level, which indicates a downward movement.
Please note: Insidebitcoins.com is not a financial advisor. Do your research before investing your funds in any financial asset or presented product or event. We are not responsible for your investing results.
Join Our Telegram channel to stay up to date on breaking news coverage