Join Our Telegram channel to stay up to date on breaking news coverage
XRP Price Prediction – May 16
XRP/USD is seen trading below the moving averages against the US dollar.
XRP/USD Market
Key Levels:
Resistance levels: $0.23, $0.24, $0.25
Support levels: $0.17, $0.16, $0.15
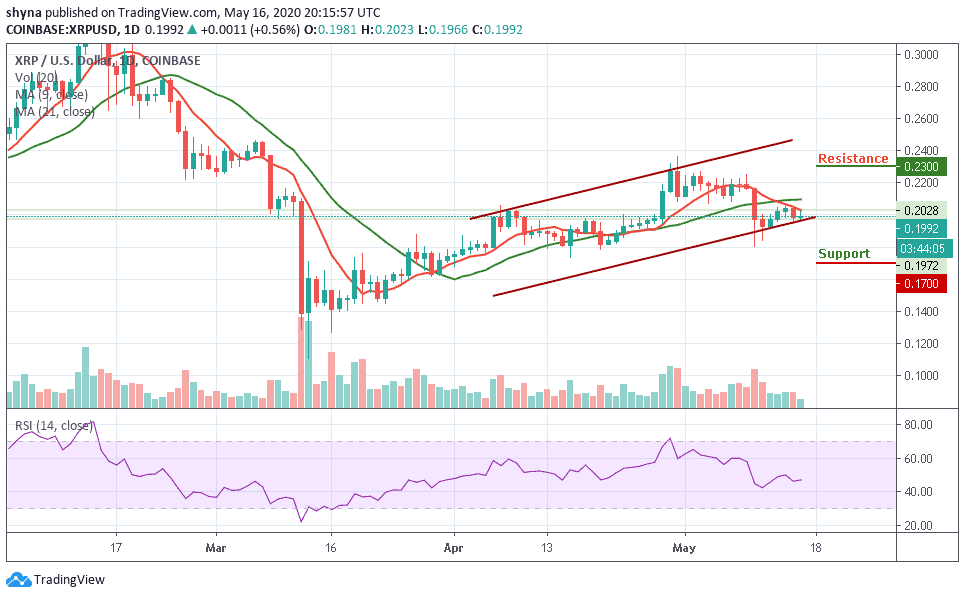
Ripple XRP/USD is slowly declining below the key supports. The coin might revisit the $0.18 support before it could start a new increase. After struggling to stay above $0.20, The price to buy Ripple (XRP) started a slow and steady decline. The coin is trading below the key $0.20 support area to move into a short term bearish zone.
However, the pair is currently exchanging hands at $0.199 and any attempt to make it cross below the lower boundary of the channel may likely open the doors for more downsides and the price could spike below the $0.19 support level. However, traders should keep an eye on the $0.18 before creating a new bullish trend at the resistance levels of $0.23, $0.24 and $0.25.
Furthermore, we may experience a quick buy once the trade reaches the support at $0.190. And if the price fails to rebound, then a bearish breakout is likely to trigger more selling opportunity for traders, which might cause the price to retest $0.17 and could further drop to $0.16 and $0.15 support levels respectively. The RSI (14) is moving around 47-level. If the green-line of 21-day MA remains above the red-line of 9-day MA, Ripple (XRP) may continue to fall more or follow a sideways movement.
Comparing with BTC, the Ripple (XRP) is moving on the downside within the descending channel. If the selling pressure persists, the XRP price variation may likely bring a new low. At the moment, the technical indicator RSI (14) is moving around 30-level; a negative move may come to play in the market as the pair moves under the 9-day and 21-day moving averages.
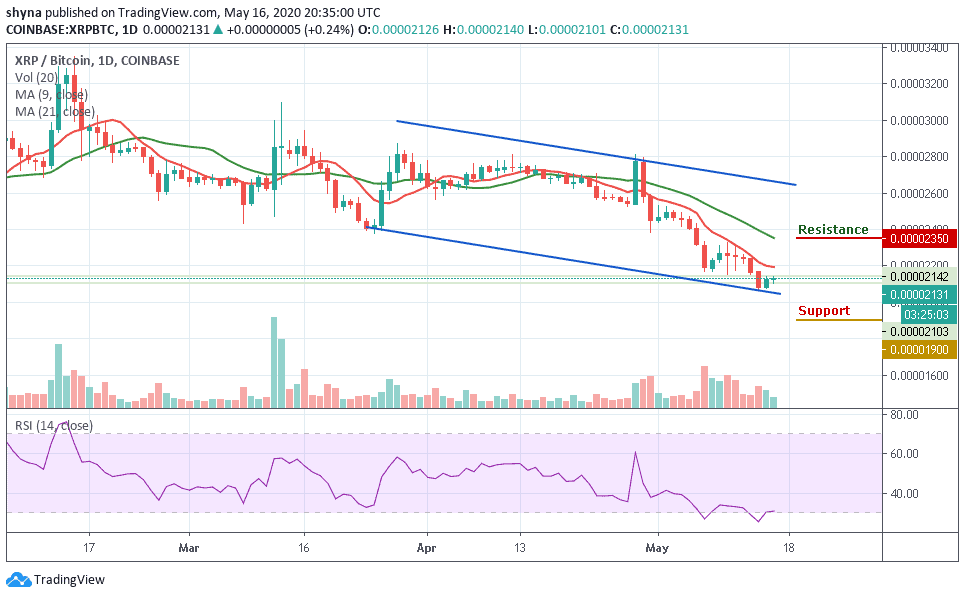
However, traders may expect close support below the lower boundary of the channel at 2000 SAT before breaking to 1900 SAT and critically 1800 SAT levels. If a bullish movement occurs and validates a break above the moving averages; we can then confirm a bull-run for the market and the nearest resistance levels lie at 2350 SAT and above.
Please note: Insidebitcoins.com is not a financial advisor. Do your research before investing your funds in any financial asset or presented product or event. We are not responsible for your investing results.
Join Our Telegram channel to stay up to date on breaking news coverage