Join Our Telegram channel to stay up to date on breaking news coverage
XRP Price Prediction – January 15
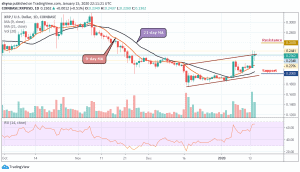
A few days ago, XRP/USD broke the previous trading range but the coin must still break above the resistance at $0.240 to turn bullish over a longer period.
XRP/USD Market
Key Levels:
Resistance levels: $0.26, $0.27, $0.28
Support levels: $0.20, $0.19, $0.18
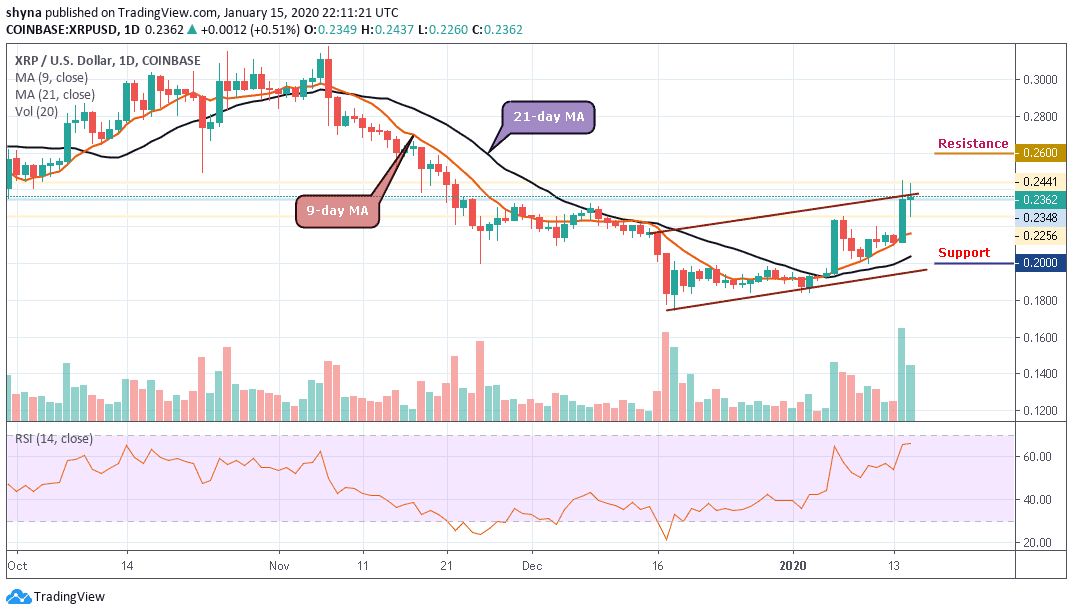
XRP/USD is now in a bullish trend in the short term but still must break above the $0.240 to confirm a longer bullish trend. If XRP was to drop back beneath $0.21 then the market would be considered as neutral once again with a break beneath $0.18 confirming a bearish trend.
Currently, the price of the coin is changing hands at $0.236 level and the bulls are still pushing the price towards the north. In other words, if the price moves below moving averages of 9-day and 21-day and break down the lower boundary of the channel, the price could be pushed to the support levels of $0.20, $0.19 and $0.18.
Moreover, the technical indicator RSI (14) is moving above the 65-level, any attempt to cross into the overbought zone will confirm the bullish trend which may likely take the coin to the nearest resistance level of $0.25, further resistance could be found at $0.26, $0.27 and $0.28 levels before the market is free to make another attempt at $0.29 level. One of the most popular ripple wallet reported that this bullish trend will continue for next 3 days.
Against Bitcoin, the pair is consolidating within the channel and moving around the 9-day and 21-day moving averages. Meanwhile, the bulls are trying to push the price above the moving average and if they succeed, the bullish continuation may take the price to the resistance levels of 2900 SAT and 3000 SAT respectively.
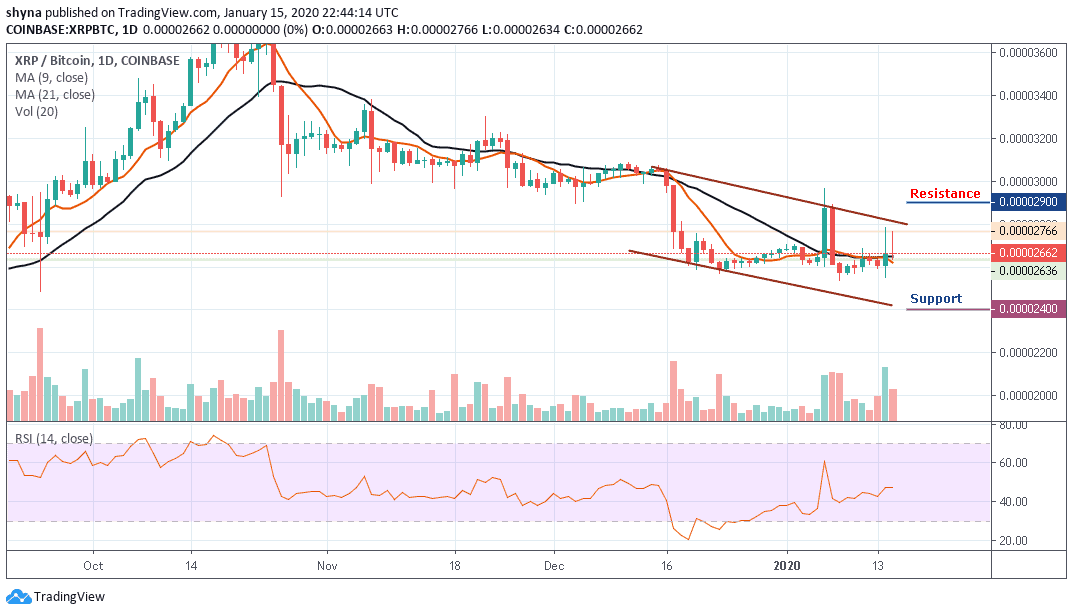
Moreover, looking at the chart, if the bulls failed to hold the price, the price of the coin may likely fall below the moving averages and cross the lower boundary of the channel and the nearest support levels of 2400 SAT and 2300 SAT. The RSI (14) moves above 45-level, which indicates a sideways movement.
Please note: Insidebitcoins.com is not a financial advisor. Do your research before investing your funds in any financial asset or presented product or event. We are not responsible for your investing results.
Join Our Telegram channel to stay up to date on breaking news coverage