Join Our Telegram channel to stay up to date on breaking news coverage
XRP Price Prediction – February 26
XRP/USD has traced a major bearish trend line; its price hovers around $0.23 but fails to maintain stability above $0.30.
XRP/USD Market
Key Levels:
Resistance levels: $0.30, $0.31, $0.32
Support levels: $0.18, $0.17, $0.16
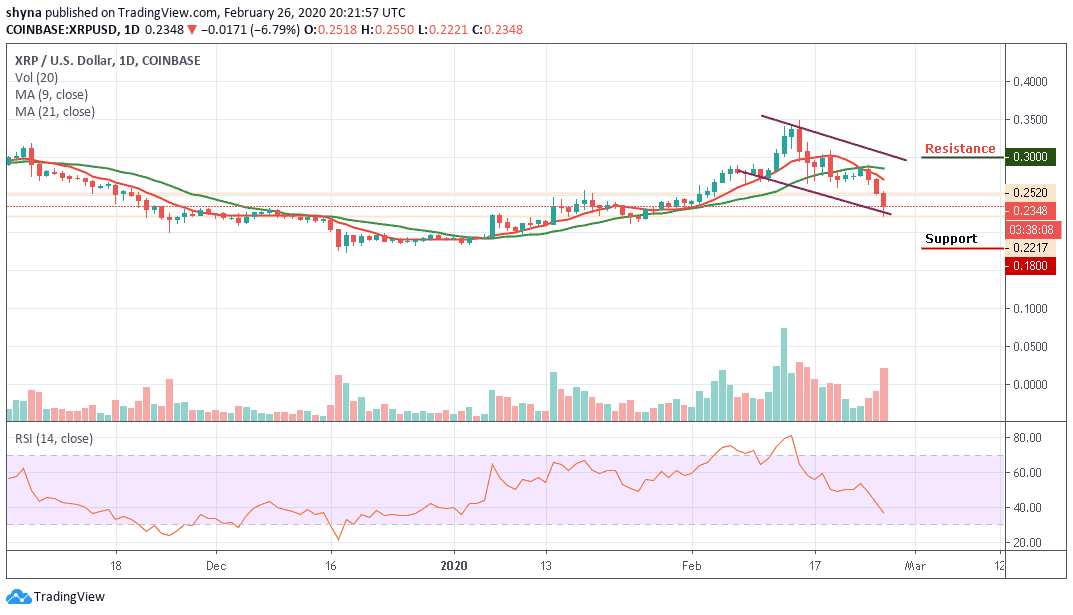
The current fall of XRP/USD has been brought by the market-wide struggle and it is likely to stay here for some more days. The current trend is at the lower side of 9-day and 21-day moving averages, which hints towards XRP’s upcoming surge. Following the path of all other coins, Ripple has also made a cut of 6.79% in the last 24 hours and the value touched $0.221 support.
Moreover, the pair is currently exchanging hands at $0.234 and any attempt to make it cross below the lower boundary of the channel may open the doors for more downsides and the price could spike below the $0.22 support level. However, we should keep an eye on the $0.21 and $0.20 before creating a new bullish trend at the resistance levels of $0.30, $0.31 and $0.32.
Furthermore, we may experience a quick buy once the trade reaches the support at $0.19. And if the price fails to rebound, then a bearish breakout is likely to trigger more selling opportunity for traders, which might cause the price to retest $0.18 and could further drop to $0.17 and $0.16 support levels respectively. The RSI (14) nosedives to 37-level. If the price moves downward, XRP/USD may fall more.
Comparing with Bitcoin, XRP moves at the downside, actually, the price action has remained intact within the descending channel. If the selling pressure continues, the XRP price variation may close this month with a new low. At the moment, the RSI (14) is crossing the 40-level; we may continue to see a negative move in the market in as much as the 9-day (orange-line) MA stays below the 21-day (green-line) MA.
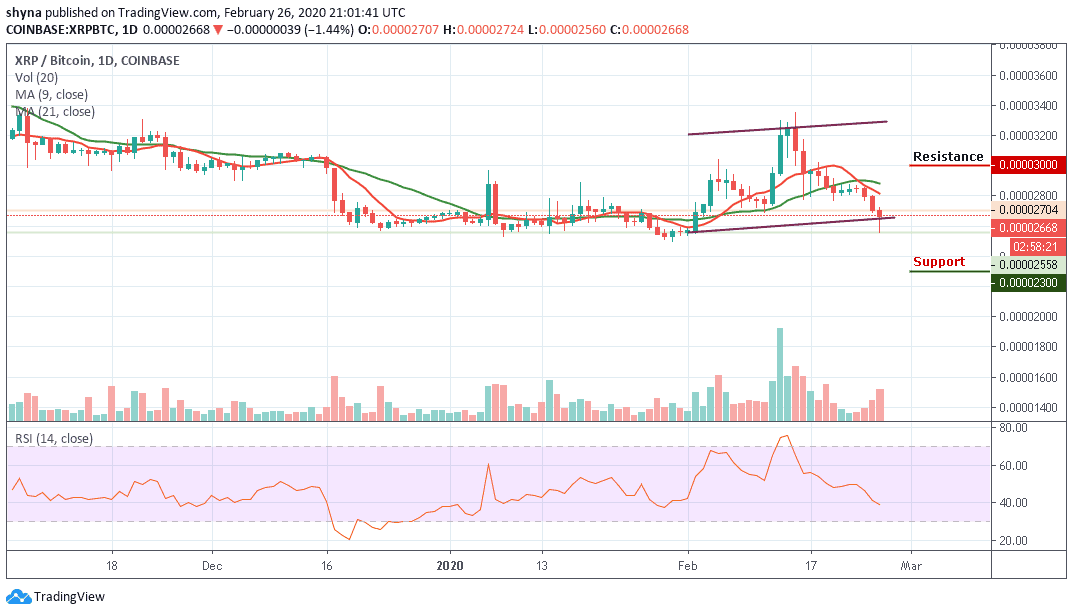
However, the coin is currently trading around the lower boundary of the channel at 2668 SAT. We may expect close support at the 2500 SAT before breaking to 2400 SAT and critically 2300 SAT levels. Should in case a bullish movement occurs and validates a break above the moving averages; we can then confirm a bull-run for the market and the nearest resistance levels to reach lies at 3000 SAT and above.
Please note: Insidebitcoins.com is not a financial advisor. Do your research before investing your funds in any financial asset or presented product or event. We are not responsible for your investing results.
Join Our Telegram channel to stay up to date on breaking news coverage