Join Our Telegram channel to stay up to date on breaking news coverage
The Quant (QNT) price prediction spikes above the upper boundary of the channel as the coin touches the daily high at $145.
Quant Prediction Statistics Data:
- Quant price now – $135.15
- Quant market cap – $1.6 billion
- Quant circulating supply – 12 million
- Quant total supply – 14.6 million
- Quant Coinmarketcap ranking – #35
QNT/USD Market
Key Levels:
Resistance levels: $175, $195, $205
Support levels: $100, $90, $80
Your capital is at risk
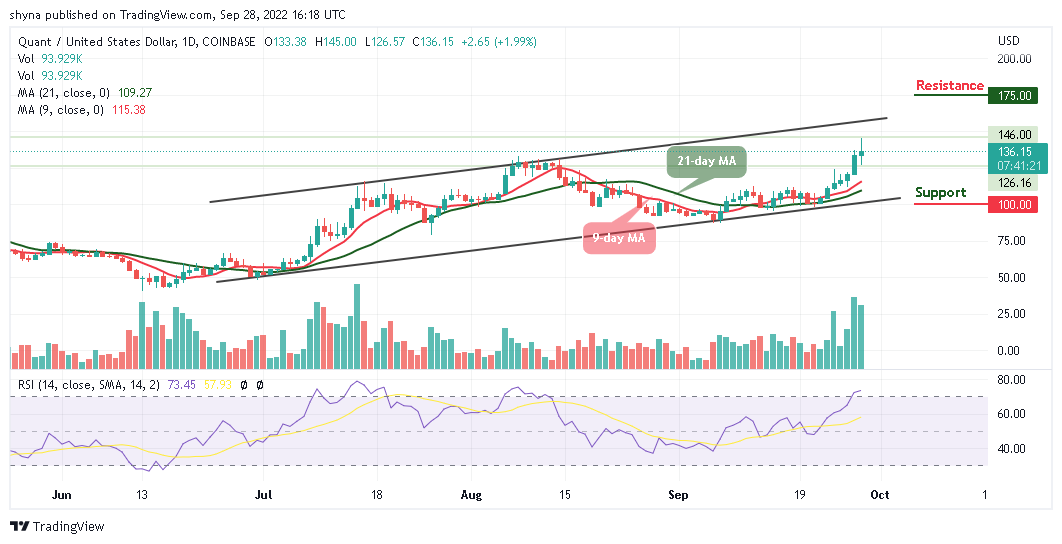
QNT/USD is breaking to the positive side as the coin keeps posting gains of 1.99% in the last 24 hours, trading above the 9-day and 21-day moving averages at the resistance level of $136.15.
Quant Price Prediction: Quant Price Shoots to the Upside
The Quant price is heading to the upside as the coin heads toward the upper boundary of the channel to touch the daily high at 145. However, if the market continues the upward movement, the $150 resistance level is likely to surface. Nevertheless, QNT/USD may further look for higher price levels if the bulls continue to show commitment.
At the time of writing, the market is displaying a tremendous bullish movement within the channel. On the other hand, if the Quant price retreats below the 9-day and 21-day moving averages, the price may likely locate the supports at $100, $90, and $80. In addition, as the Relative Strength Index (14) moves into the overbought region, the next resistance levels could be found at $175, $195, and $205 respectively.
Against Bitcoin, Quant (QNT) is rising as the coin recently spikes above the upper boundary of the channel to touch the daily high at 6717 SAT, as it continues to rise towards the nearest resistance level of 7700 SAT. Moreover, crossing above the channel could hit the resistance level at 8000 SAT and above.
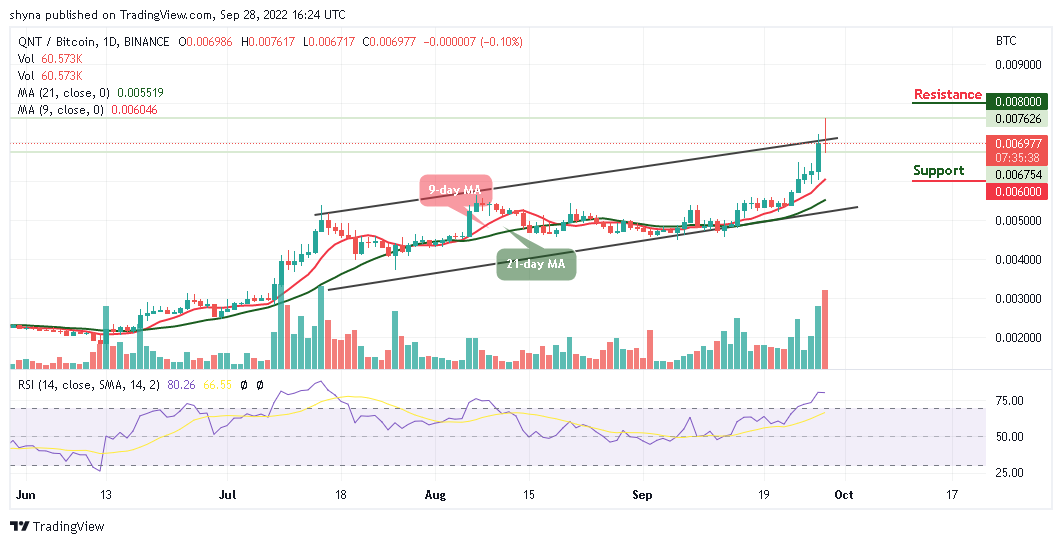
In other words, any bearish movement by the bears to send the coin below the 9-day moving average may locate the support level at 6000 SAT and below. Meanwhile, the technical indicator confirms the bullish movement as the coin could gain more bullish signals.
Join Our Telegram channel to stay up to date on breaking news coverage