Join Our Telegram channel to stay up to date on breaking news coverage
NEO Price Analysis – August 25
NEO has reflected a pretty impressive price movement in the past couple of days. There were some pull-backs, but the coin struggled and made it to the top.
NEO/USD Market
Key Levels:
Resistance levels: $12.0, $12.5, $13.0
Support levels: $7.0, $6.5, $6.0
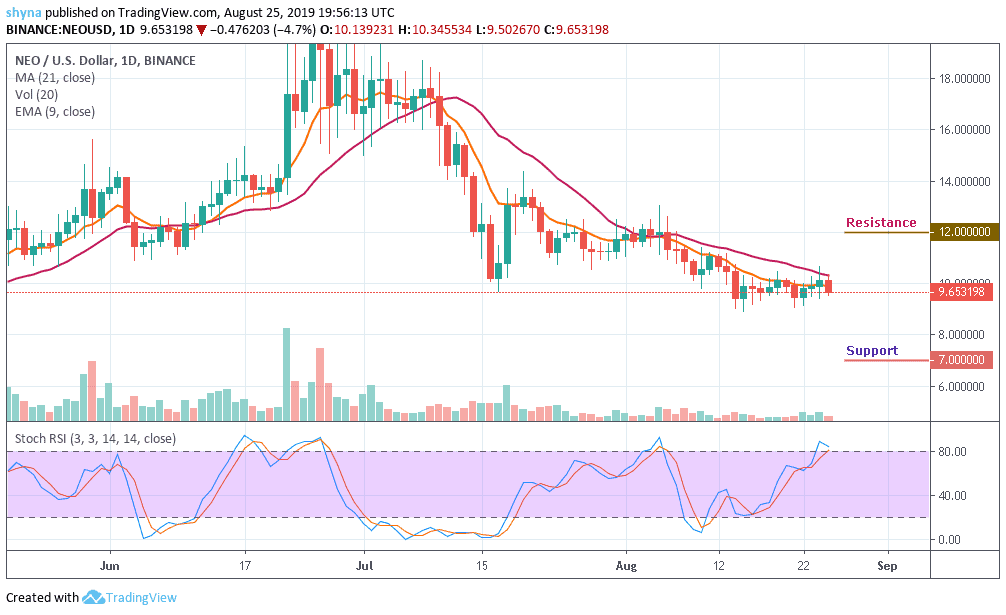
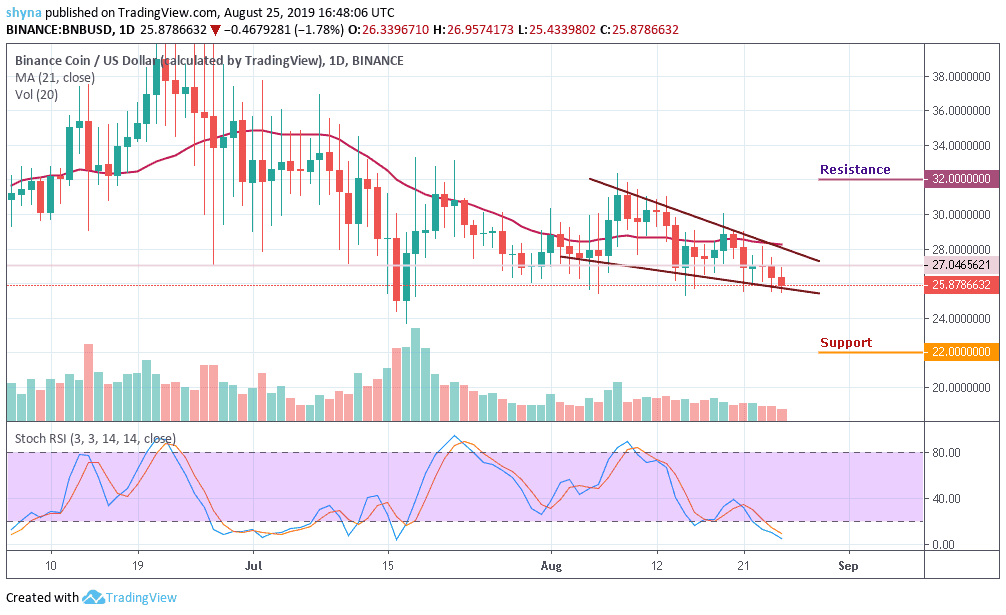
NEO price is indicating an indecisive in the market movement around the 21-day MA (brown line) and 9-day EMA (orange line). The coin is bitten by the bear and once again the expectations of upsurge are ruined. We were quite apprehensive about the progression of the coin, but it looks like the coin would take time to improve. The currency is slipping on the crypto chart in terms of rank.
However, as the NEO price remains jerky, we await the possible direction of the coin. For a positive peak, the $12.0, $12.5 and $13.0 are the main resistance levels for the token at the moment. Looking at the volume of the chart, we can see the NEO at its lowest. As a result, a negative spike could test significant support at $7.0 and $6.5 before a slippage of $6.0. More so, NEO/USD is bearish in the long run as the stochastic RSI is currently moving towards the overbought zone.
NEO/BTC Market
Comparing with Bitcoin, NEO performance has been very low due to a recurring Against BTC, the pair has already moved above the moving averages of 21 and 9 periods before falling back to break solid support of 950SAT. NEO price may likely see another sharp drop at 900SAT support level. Breaking this level could further drag the market to the nearest support levels at 800SAT, 750SAT, and 700SAT.
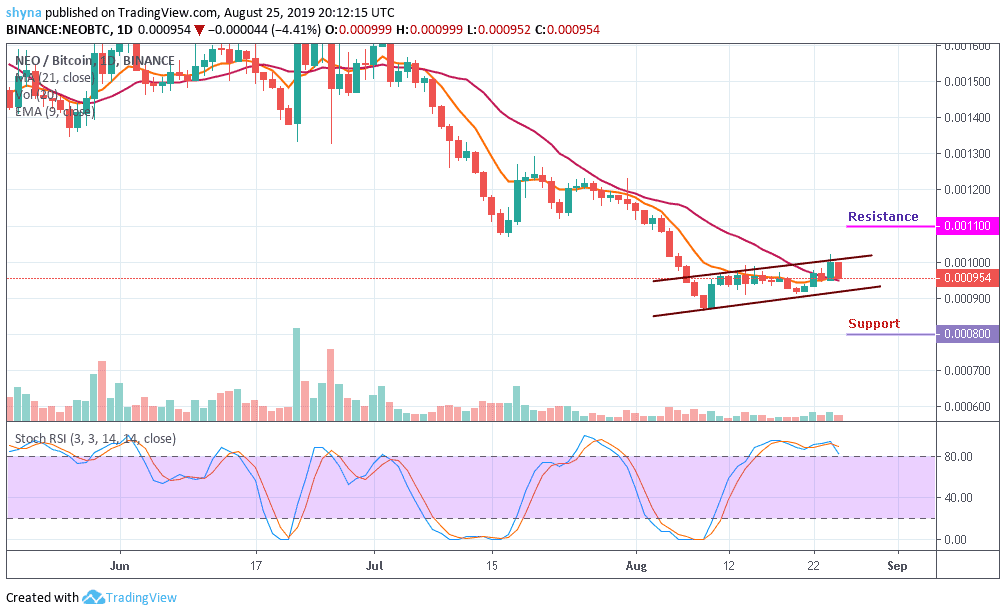
However, NEO is currently changing hands at 954SAT and if the bulls can hold the price tight as it is, the next key targets price lies at 1100SAT and 1150SAT respectively. Reaching these levels might move it to 1200SAT level. Meanwhile, the stochastic RSI is now lying at the overbought territory; possible selling pressure is likely if it turns backward.
Please note: insidebitcoins.com is not a financial advisor. Do your own research before investing your funds in any financial asset or presented product or event. We are not responsible for your investing results.
Join Our Telegram channel to stay up to date on breaking news coverage