


Join Our Telegram channel to stay up to date on breaking news coverage
MKRUSD Price Analysis – August 08
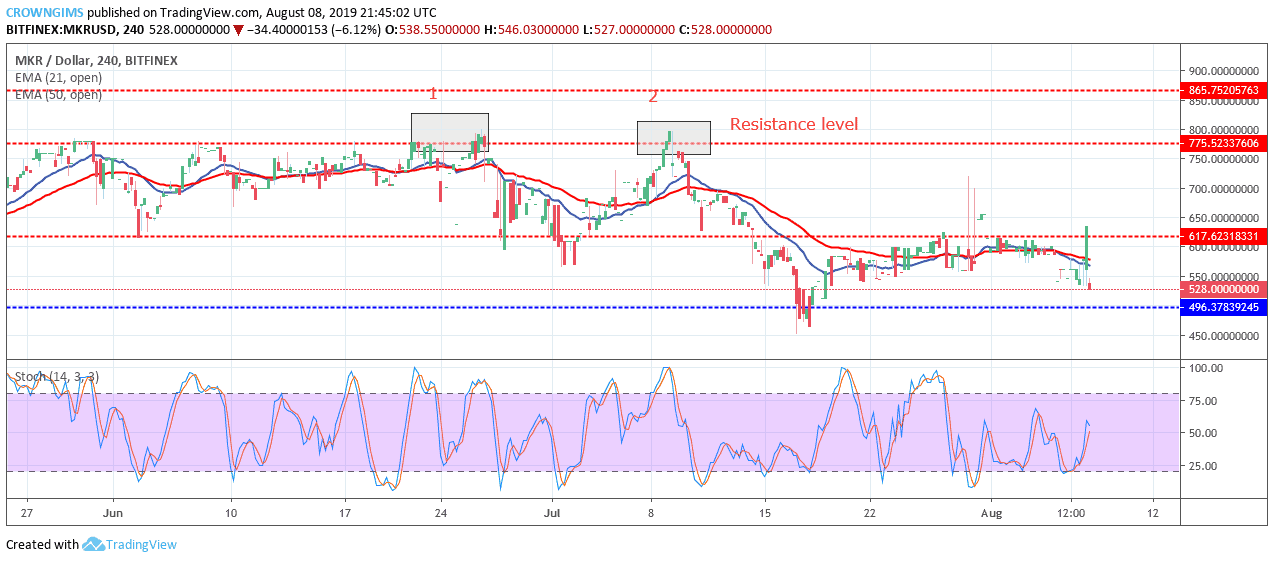
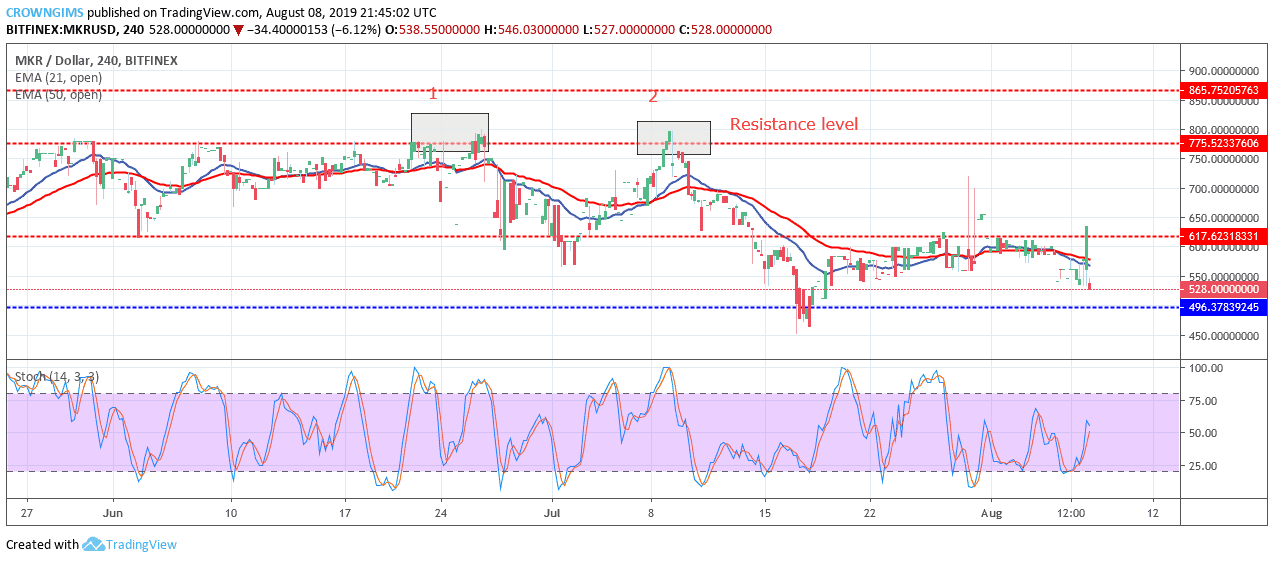
Further decrease in MKR (Maker) price is possible only when the Bears increase their momentum and the demand level of $496 may be broken downside.
GBP/JPY Market
Key levels:
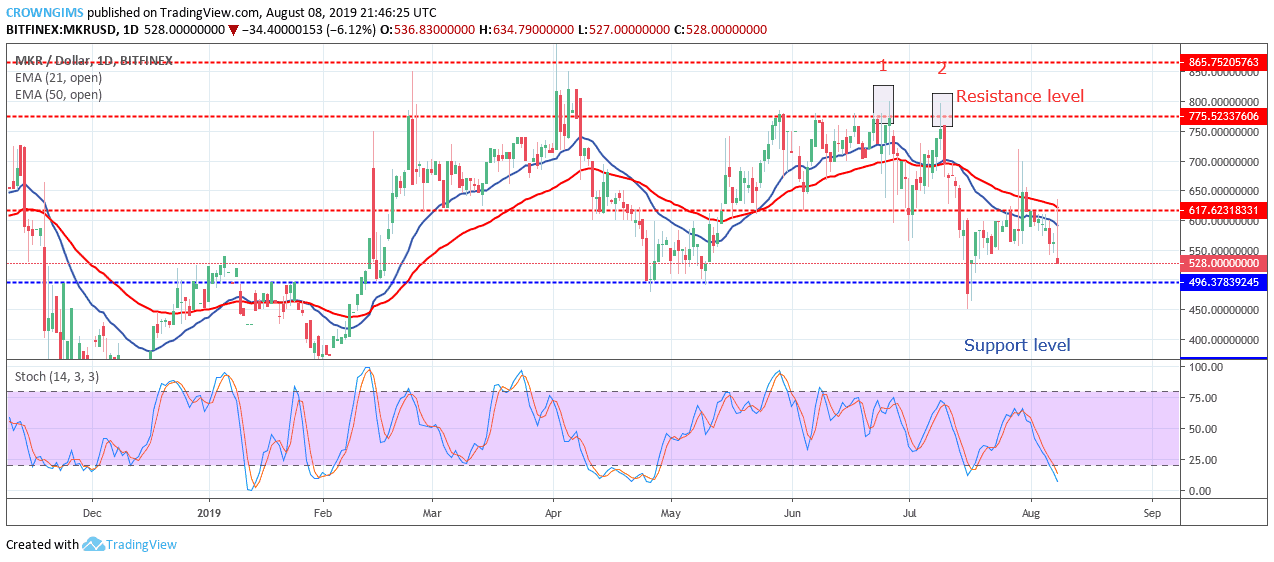
Resistance levels: $617, $775, $865
Support levels: $496, $355, $191
MKRUSD Long-term trend: Bearish
On the long-term outlook, MKRUSD is bearish. The price action of the MKRUSD tested the resistance level of $775 twice; this formed a double top chart pattern on the daily chart. The double top pattern brought about the fall of Maker (MKR) price to the support level of $496. Further decrease in price was opposed by the Bulls and the price started ranging within the resistance level of $617 and the support level of $496.
The Bears have pushed the price below the two EMAs. The trading of Maker (MKR) continues below 21 periods EMA and the 50 periods EMA. Further decrease in MKR (Maker) price is possible only when the Bears increase their momentum and the demand level of $496 may be broken downside. Meanwhile, the Stochastic Oscillator period 14 is below 20 levels (oversold level) and the signal lines pointing down to indicate a further reduction in Maker price.
MKRUSD medium-term Trend: Bullish
MKRUSD is bullish on the medium-term outlook. The coin was on the sideways movement within the resistance level of $617 and the support level of $496 for more than two weeks. Today, the Bulls gained momentum and pushed up the price to break the resistance level of $617.
The currency is trading above the 21 periods EMA and 50 periods EMA to indicate that the Bulls are taking over the MKR market gradually. The stochastic Oscillator period 14 is below 50 levels and the signal lines pointing up to indicate buy signal and a further increase in price.
Please note: insidebitcoins.com is not a financial advisor. Do your research before investing your funds in any financial asset or presented product or event. We are not responsible for your investing results.
Join Our Telegram channel to stay up to date on breaking news coverage
