Join Our Telegram channel to stay up to date on breaking news coverage
LTC/USD
From last Monday, March 18th, when the price of Litecoin was $64.287 at the open which was the highest point since the beginning of the year, measured to the current level on which the crypto is sitting at $60.1 we have seen a decrease of 6.53%.
The price came down lower last week as it was being traded at around $59 at its lowest on Thursday but from there made a recovery to around $62.45 before the start of the minor downtrend on Saturday.
On the hourly chart, you can see that the price of Litecoin came up to the ascending trendline which is the resistance line of an ending diagonal seen on a higher time-frame and as it encountered resistance there on the spike which interacted with the level last Monday another descending structure started forming as the interaction ended as a rejection.
The price is currently around the horizontal support level of the current range which was the resistance level of the previous one and is retesting it for support. As the price went below it last week and stayed there for some time the level isn’t as significant which is why another downfall below it would be likely.
As the price retested the descending structure’s resistance line on Saturday another minor downtrend has started and judging by the wave structure the first five-wave move has ended or is near completion which is why now another retest could be likely which would be a corrective three-wave move to around $61.4 before another five-wave move to the downside starts.
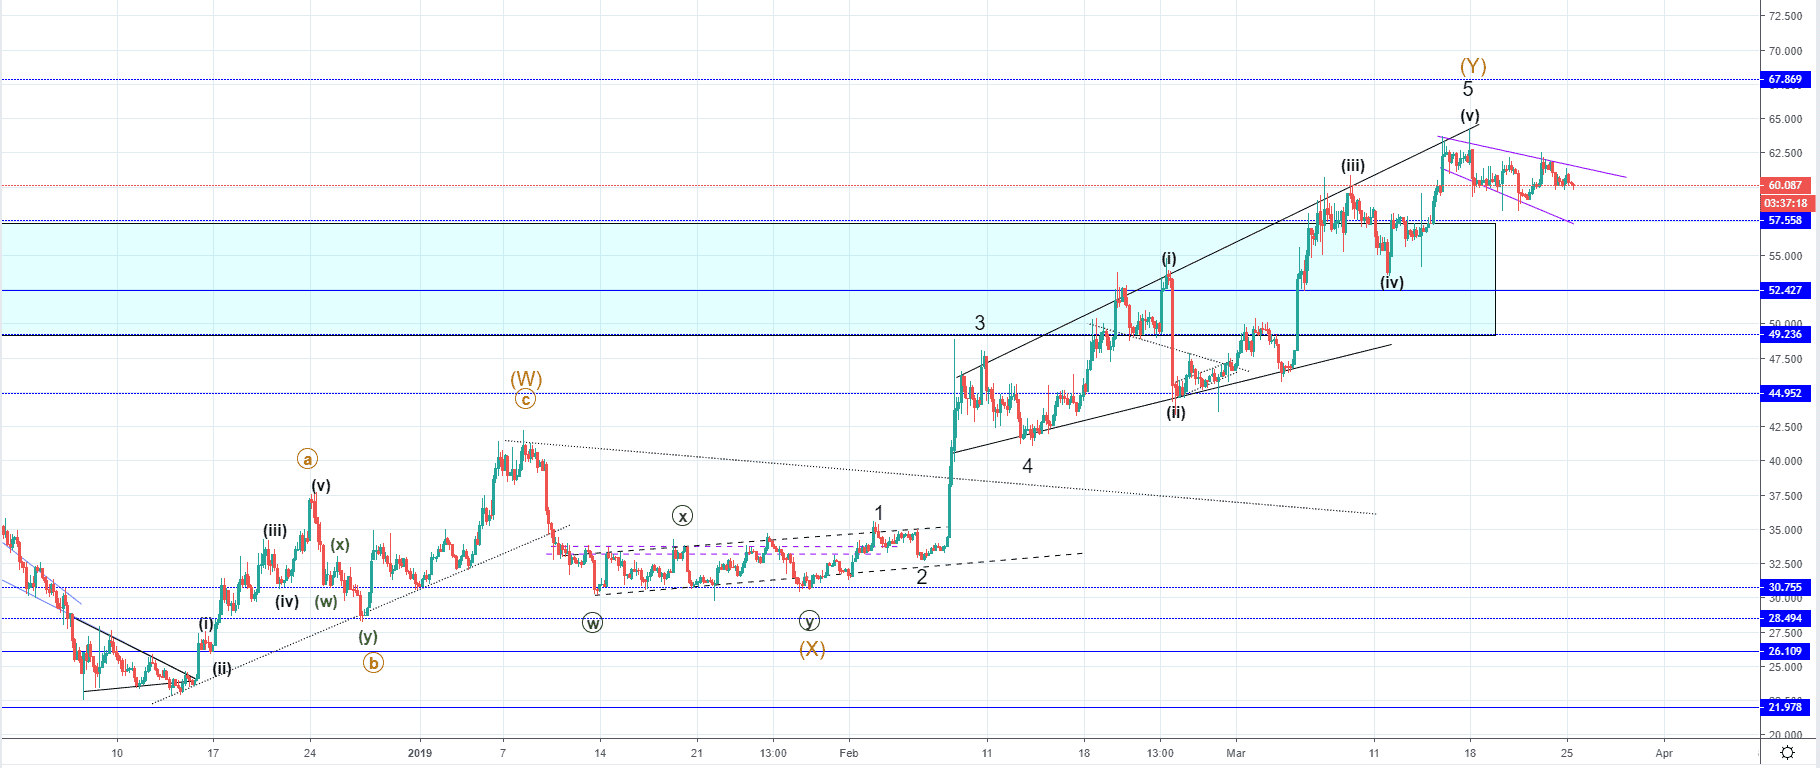
Zooming out on to the 4-hour chart, you can see that the price of Litecoin is still above the resistance zone. The price came close to the most upper horizontal level at $67.869 but the interaction hasn’t been made which is why although I believe that the uptrend ended as a corrective three-wave move, the price could continue for another minor increase to the mentioned level.
As you can see according to my count we have seen the end of the 5th wave out of the corrective wave Y as the price action formed an ending diagonal which is indicative of the impulse wave ending point.
The current descending structure looks corrective which is why another increase could be made if the Minuette wave could still have more room to go. As the WXY correction ended or is near completion a move to the downside would be expected from here below the resistance zone a potentially below the horizontal support level at $44.952.
If we are to see an impulsive move to the downside as a trend continuation after the three-wave correction to the upside ended the price is set to go for new lows below the one in December when the price of Litecoin came down to around $22.
Considering that the price has entered the seller’s territory as it came above the resistance area, the start of an impulsive move is very likely as hard selling could be triggered, especially if the price continues for another minor increase.
Join Our Telegram channel to stay up to date on breaking news coverage


