Join Our Telegram channel to stay up to date on breaking news coverage
LTC Price Prediction – November 14
After peaking at $64.24 on November 6, the Litecoin price has plunged to a low of $59.24 as of today.
LTC/USD Market
Key Levels:
Resistance levels: $64, $66, $68
Support levels: $52, $50, $48
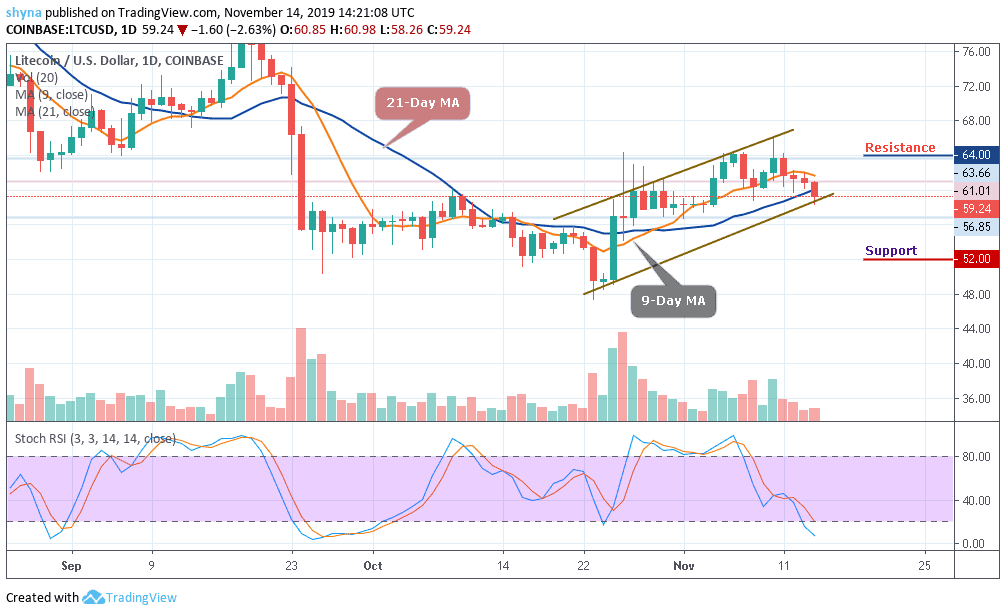
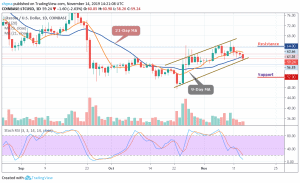
At the time of writing, LTC/USD has been trading down around -3.0% at its current price of $59.24; the coin is down slightly from its 24-hour highs of $61.01. While zooming out and looking at Litecoin’s price action for the past few day’s trading periods, it is clear of how much volatility it has been incurring, as it is now, the price is trading under the 9-day and 21-day moving averages and about to break below the lower trend line.
Moreover, from above, the nearest level of resistance lies at the $61 level as it contains the 9-day moving average. Above this, higher resistance lies at $63. If the buyers can climb above the $63 resistance, then further resistance may be found at $64, $66, and $68. Similarly, from below; the nearest levels of support are $57, below this; further support lies at $56 and 54.
In addition, if the sellers continue to push the price beneath the support level of $54, then, the $52, $50 and $48 support levels could be touched. At the moment, looking at the daily chart, the stochastic RSI is seen moving into the oversold zone, which may likely bring more bearish signals into the market.
Against Bitcoin, Litecoin price is moving down slowly below the 9-day moving average and targeting to cross below the 21-day moving average; For now, the bulls continue to dance to the tune of the bears and currently trading at the 6853 SAT level. At the moment, the buyers are still suffering a serious downtrend pressure from the sellers.
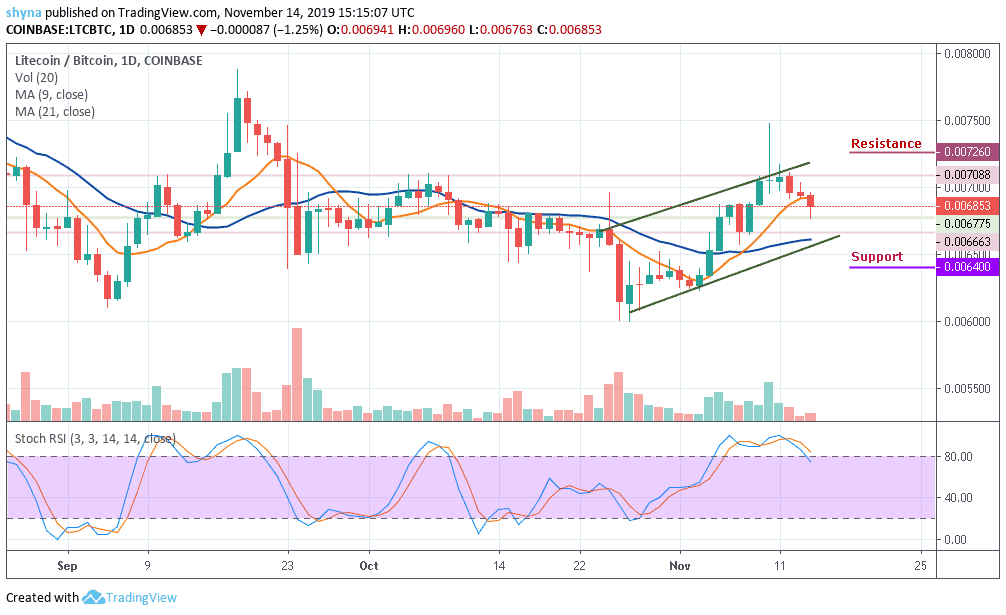
However, if the price cross below the trend line of the channel, the nearest key support lie at 6670 SAT, but further support could be found at 6400 SAT and 6200 SAT in a subsequent move. Similarly, an upward movement above the channel is likely to find immediate resistance at 7088 SAT, If the bulls climb above this level, higher resistance lies at 7260 SAT and above. Meanwhile, the stochastic RSI is convincingly leaving the overbought zone and as it stands now, the bears are gaining control of the market.
Please note: Insidebitcoins.com is not a financial advisor. Do your research before investing your funds in any financial asset or presented product or event. We are not responsible for your investing results.
Join Our Telegram channel to stay up to date on breaking news coverage