Join Our Telegram channel to stay up to date on breaking news coverage
LTC Price Prediction – January 28
Litecoin (LTC) manages to maintain its position despite volatility, while the bulls still maintain the desire to defend the support of $55.
LTC/USD Market
Key Levels:
Resistance levels: $66, $68, $70
Support levels: $53, $51, $49
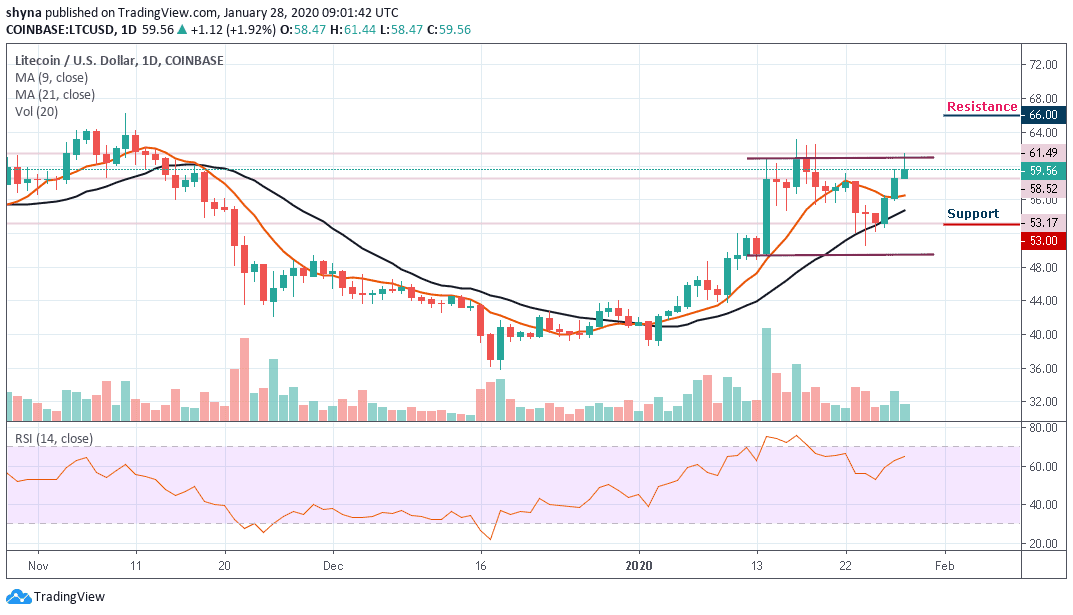
In the last three days, LTC/USD bulls took charge of the market where the market price bounced off the $53.17 support level and jumped up to $61.49, crossing the $60-barrier, in the process. The coin posted gains of over 1.92% in the last 24 hours, with the coin trading above the 9-day and 21-day moving averages and at a price of $59.56 at the time of writing.
Today, LTC/USD has resumed back in the middle of consolidation after a slight drop from near the $61. The price is now roaming around the $59 level. If the market continues the surge and squeeze, the $62 resistance level is likely to surface in the next few positive moves. More so, the Litecoin (LTC) may further look for higher price levels in as much as the bulls continue to show commitment.
However, the market is currently displaying a sign of subduing volatility with choppy price action while the daily chart reveals that the trading volume is rising slowly. If the LTC/USD pair decides to stay under the control of bears, the price may roll back to previous supports at $53, $51 and $49. On the upside, the market price may reach the next level of resistance at $66, $68 and $70. Meanwhile, the RSI (14) is moving towards the 65-level, which suggests more bullish signals.
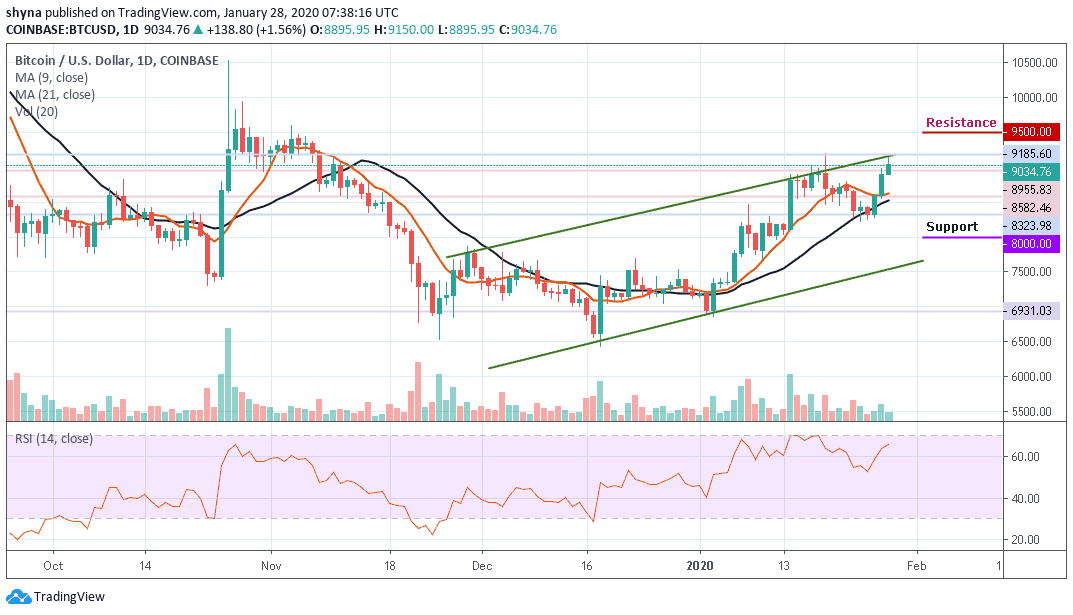
Against Bitcoin, looking at the chart, the bulls are making effort to step back into the market by halting the downtrend that occurred last week. More so, the coin is trying to show some promising signs that could make higher highs should it continue to move above the 9-day and 21-day moving averages. From the upside, the nearest level of resistance lies at 7100 SAT, above this, higher resistance lies at 7300 SAT and 7500 SAT.

Furthermore, from downside; the nearest levels of support are 6400 SAT and beneath this, further support lies at 6200 SAT. If the price drops further to create a new low, lower support is located at 6100 SAT, 5900 SAT, and 5700 SAT. The RSI (14) is making an attempt to break above the 60-level which shows that the bulls are in control.
Please note: Insidebitcoins.com is not a financial advisor. Do your research before investing your funds in any financial asset or presented product or event. We are not responsible for your investing results.
Join Our Telegram channel to stay up to date on breaking news coverage