Join Our Telegram channel to stay up to date on breaking news coverage
LTC Price Prediction – November 4
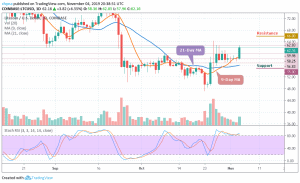
Today, out of the top-10 cryptos, Litecoin is the best-performing coin and the further recovery may be capped by $62.33.
LTC/USD Market
Key Levels:
Resistance levels: $66, $68, $70
Support levels: $55, $53, $51

After being locked below $60 on the price charts, LTC/USD underwent a much-needed break to the positive side. The coin posted gains of over 5.80% in the last 24 hours, with the coin trading above the 9-day and 21-day moving averages and at a price of $62.16 as at the time of writing.
Today, LTC/USD has resumed back in the middle of consolidation after a slight drop from near the $56. The price is now roaming around the $62.16 level. If the market continues the surge and squeeze, the $64 resistance level is likely to surface in the next few positive moves. More so, the LTC/USD pair might further look for higher price levels if the bulls continue to show commitment.
However, the market is currently displaying a sign of subduing volatility with choppy price action. Taking a look at the daily chart, we can see the trading volume is rising slowly. If the LTC/USD pair decides to stay under the control of bears, the price may roll back to previous supports at $55, $53 and $52. But on the upside, we can expect the next level of resistance at $66, $68 and $70.
Meanwhile, the stochastic RSI is hovering at the overbought zone, which indicates that bearish movement may likely come into play.
Against Bitcoin, looking at the chart, the bulls are making effort to step back into the market by halting the downtrend. More so, the coin is trying to show some promising signs that could make higher highs should it continue to move above the 9-day and 21-day moving averages. From the upside, the nearest level of resistance lies at 6800 SAT and above this, higher resistance lies at 7000 SAT and 7200 SAT.
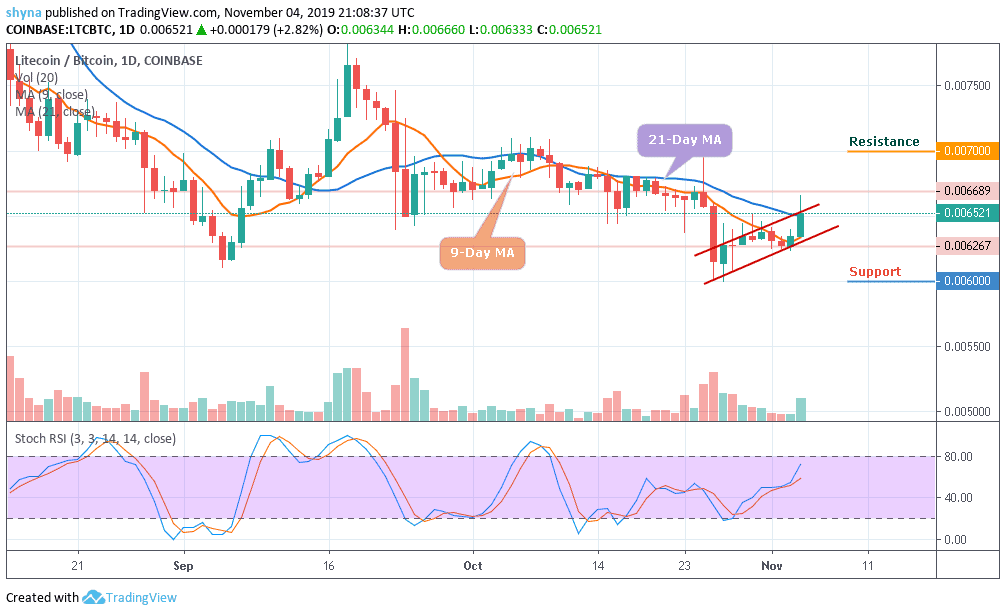
In other words, from downside; the nearest levels of support are 6250 SAT and beneath this, further support lies at 6100 SAT. If the price drops further to create a new low, lower support is located at 6000 SAT, 5800 SAT, and 5600 SAT. The stochastic RSI is making an attempt to break above the 60-level which shows that the bulls are coming into play.
Please note: Insidebitcoins.com is not a financial advisor. Do your research before investing your funds in any financial asset or presented product or event. We are not responsible for your investing results.
Join Our Telegram channel to stay up to date on breaking news coverage