Join Our Telegram channel to stay up to date on breaking news coverage
LTC Price Prediction – October 14
After two days of the bullish movement, LTC/USD has recovered above the 21-day moving average. A sustainable movement above the $60 resistance level is needed to stimulate recovery.
LTC/USD Market
Key Levels:
Resistance levels: $65, $70, $75
Support levels: $50, $45, $40
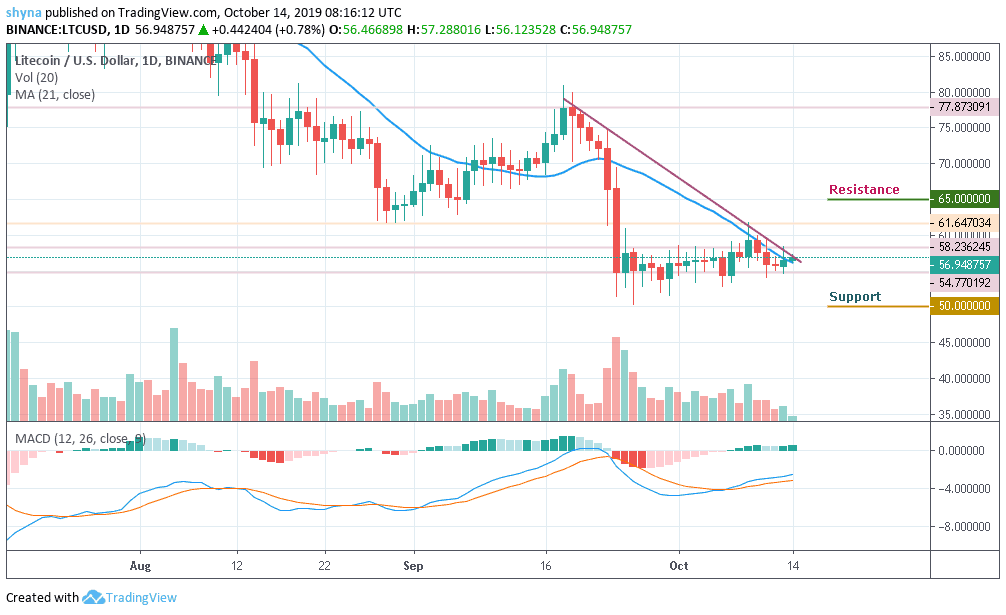
Litecoin price is currently trading at the support provided by a rising trend line. However, a break above the trend line could suggest that the market is headed higher. Still, Litecoin has seen a slight increase of 1.17% in the past 24 hours, putting the coin’s market cap to$3.63 billion and in sixth place amongst the top cryptocurrencies.
However, as the market opens today, Litecoin price started trading at $56.34 and it’s recovering towards $56.9 as at now. A bullish regroup may bring a decisive move with a potential break above the 21-day moving average and the descending trend line. If such a scenario occurs, the price is likely to go as high as $65, $70, and $75. On the long-term outlook, LTC/USD remains indecisive as a rebound is possible if the $56 can act strong.
While price remains indecisive, the LTC trading is likely to go down to the $50, $45 and $40 supports if the bears turn up. To follow the MACD signal which is now reflected in the positive zone following the recent substantial rise in the market and leading to a price bounce on the daily chart, a possible upsurge is likely to push the market to the north.
Against Bitcoin, Litecoin price is moving slowly within the symmetric triangle and above the 21-day moving average. Despite the bounce up, the 3rd best performing cryptocurrency is yet to define an actual direction as price actions remained subdued with choppy price actions since the daily opening.
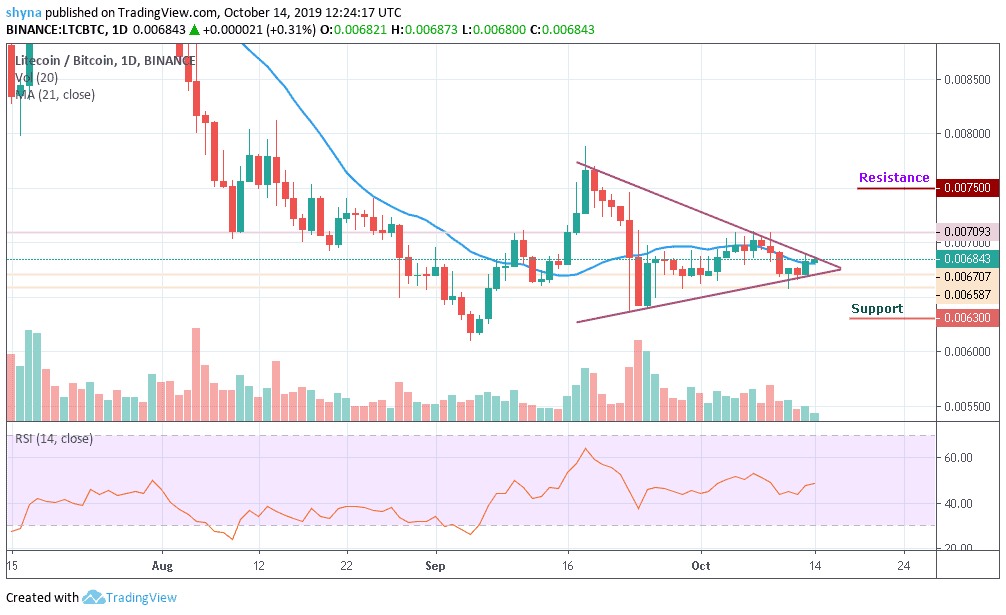
However, the nearest key supports lie at 0.0063 BTC, 0.0060 BTC and 0.0057 BTC in a subsequent move. Similarly, an upward movement across the symmetric triangle is likely to find immediate resistance at 0.0075 BTC and above. Meanwhile, the RSI (14) is convincingly moving towards level 50 and as it stands now, the bulls are likely to gain control of the market.
Please note: Insidebitcoins.com is not a financial advisor. Do your research before investing your funds in any financial asset or presented product or event. We are not responsible for your investing results.
Join Our Telegram channel to stay up to date on breaking news coverage