Join Our Telegram channel to stay up to date on breaking news coverage
LTC Price Prediction – November 30
Litecoin trades at $47.99 with slight support from the short-term moving averages and also trading with utmost selling pressure.
LTC/USD Market
Key Levels:
Resistance levels: $54, $56, $58
Support levels: $42, $40, $38
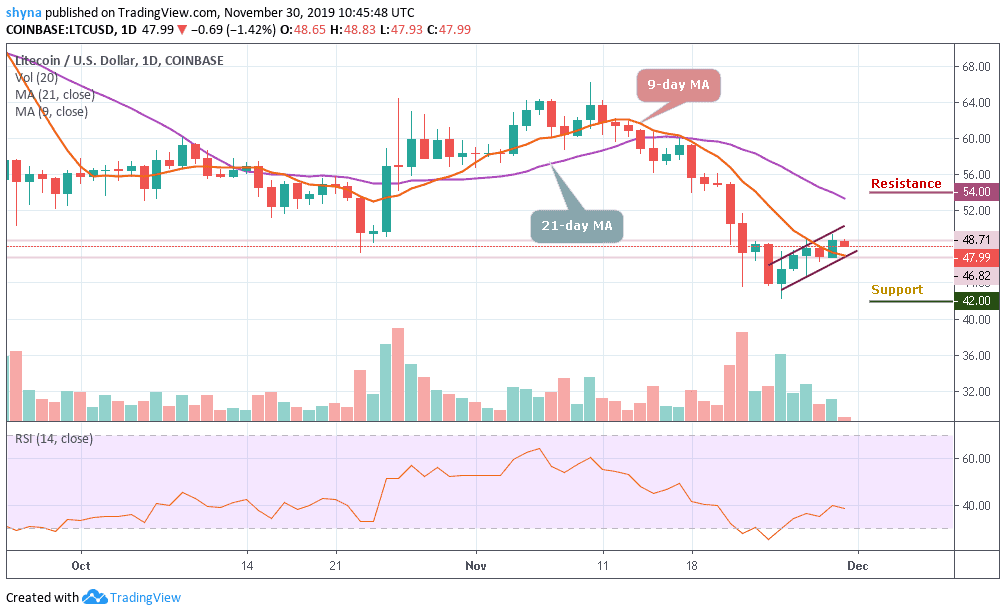
LTC/USD is still trapped in incredibly narrow trading after a bullish rally failed to materialize. In fact, the cryptocurrency is trading in its tightest six days trading band after the bulls took over from the bears. An early trading session towards the $50 level failed to generate sustainable gains, with the LTC/USD pair slipping back under the $48 level.
However, the longer the pair fails to rally from current trading levels, the greater the chance that we may see the cryptocurrency falling to a new month trading low. A break below the $46 support level may provoke an even deeper decline towards the $42, $40 and $38 levels. Meanwhile, the short-term technical analysis by a leading stock broker shows that the $47 and $48 levels are currently the strongest forms of technical support before the $46 level starts to come back into focus.
Moreover, the daily chart highlights that the LTC/USD needs to break the technical region of the $58 level which is above the upper boundary of the ascending channel. The 21-day moving average for the coin is located at the $54, $56 and $58 resistance levels, and a move above this key technical metric should encourage further LTC/USD buying. For now, the RSI (14) for Litecoin is currently moving below 40-level which may likely release some bearish signals in the near term. Even the best litecoin wallet companies are investing a lot to go along with the bull trend.
Against Bitcoin, the daily chart has shown that the sellers are still dominating the market with a heavy surge as the price moves below the moving averages of 9-day and 21-day. For now, the immediate key support level to watch for lies at 6000 SAT and 5900 SAT. A further drop may slip the price to 5800 SAT.
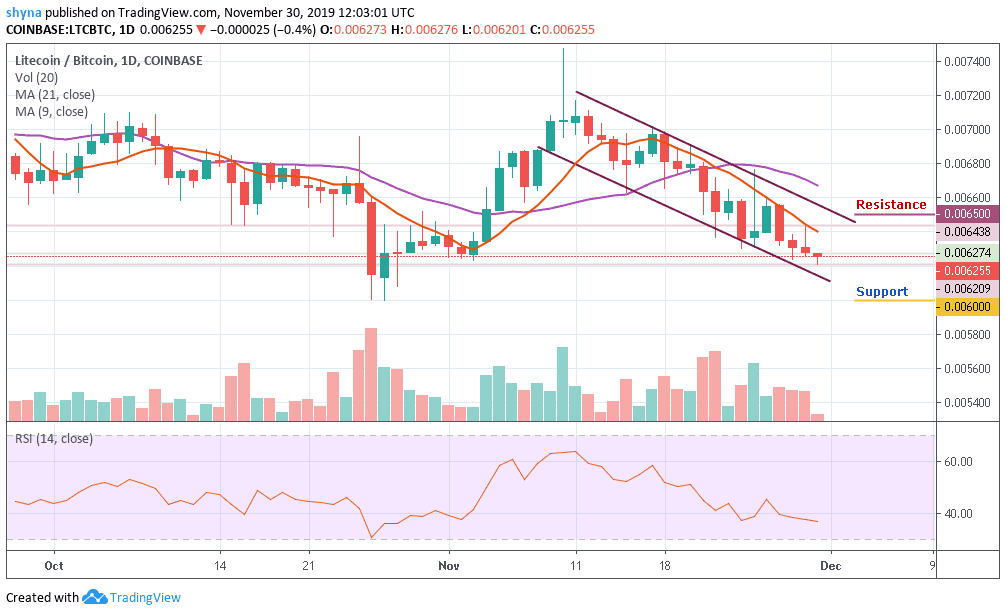
Nevertheless, for a retracement move, the 6300 SAT resistance is likely to resurface before the rally continues. If the 6300 SAT could contain the retracement, the price may further swing to 6500 SAT, 6600 SAT and 6700 SAT resistance levels. Currently, the RSI (14) keeps moving below the 40-level, which could generate more bearish signals in the market.
Please note: Insidebitcoins.com is not a financial advisor. Do your research before investing your funds in any financial asset or presented product or event. We are not responsible for your investing results.
Join Our Telegram channel to stay up to date on breaking news coverage