Join Our Telegram channel to stay up to date on breaking news coverage
LTC Price Prediction – March 13
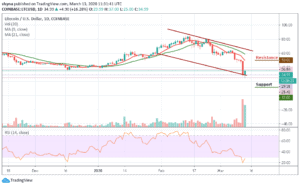
Today, LTC/USD hit the intraday low at $25.43, which is the lowest level since December 2018.
LTC/USD Market
Key Levels:
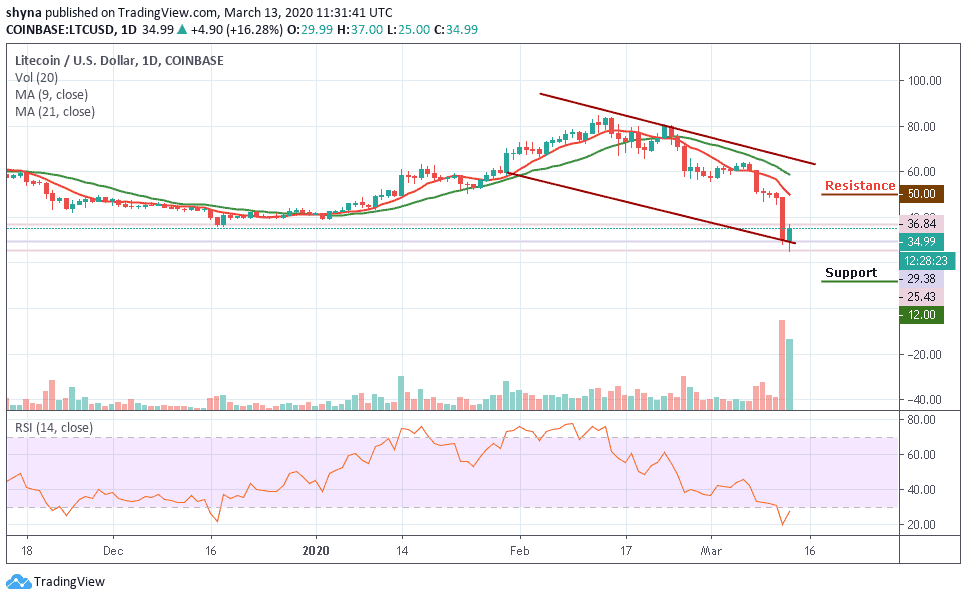
Resistance levels: $50, $52, $54
Support levels: $12, $10, $8
Litecoin price has taken the downhill road. In the past few days, LTC/USD was spotted dealing at $49, and then later dribbled to $30. The tremendous loss in the price is indicating a delayed recovery. However, Litecoin has given some great results in the past. But the coin is speculated to retain the same momentum in some time. The current market pressure seems to take a while, but once it is lifted, the coin could once again shine.
The more the LTC/USD pair fails to recover from the current trading levels, the greater the chances that we will see cryptocurrency falling to another new trading low. More so, a break below the $20 support level may provoke an even deeper decline towards the $12, $10 and $8 levels. Short-term technical analysis shows that the $35 and $33 levels are currently the strongest forms of technical support before the $30 level starts to come into focus.
At the time of writing, LTC/USD is changing hands at $34.99., a break above the $45 level will propel Litecoin to a high of $50, $52 and $54 resistance levels. Meanwhile, the RSI (14) is at the oversold zone indicating the coming of the bullish movement in the market.
Against Bitcoin, the daily chart has shown that the buyers are dominating the market with a heavy upsurge as the price touches 6626 SAT above the 9-day moving average. Meanwhile, if the bulls can put more effort, the price may break above the 21-day moving average within the channel, the key resistance levels lie at 6900 SAT and 7200 SAT.
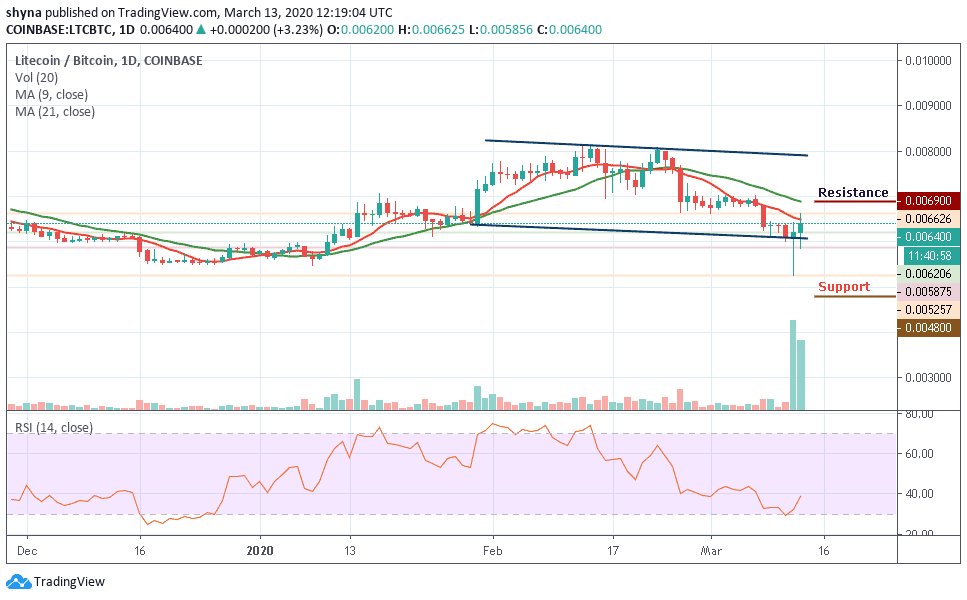
Moreover, for a reversed move, the 5800 SAT is likely to resurface and if the 5200 SAT could not hold it, the price may further drop to 4800 SAT and 4600 SAT support levels. Meanwhile, the RSI (14) is making a quick turn towards the north, which could give bullish signals into the market.
Join Our Telegram channel to stay up to date on breaking news coverage