Join Our Telegram channel to stay up to date on breaking news coverage
LTC Price Prediction – April 16
The Litecoin price could start a new fresh increase if buying pressure increases above the immediate resistance.
LTC/USD Market
Key Levels:
Resistance levels: $54, $56, $58
Support levels: $28, $26, $24

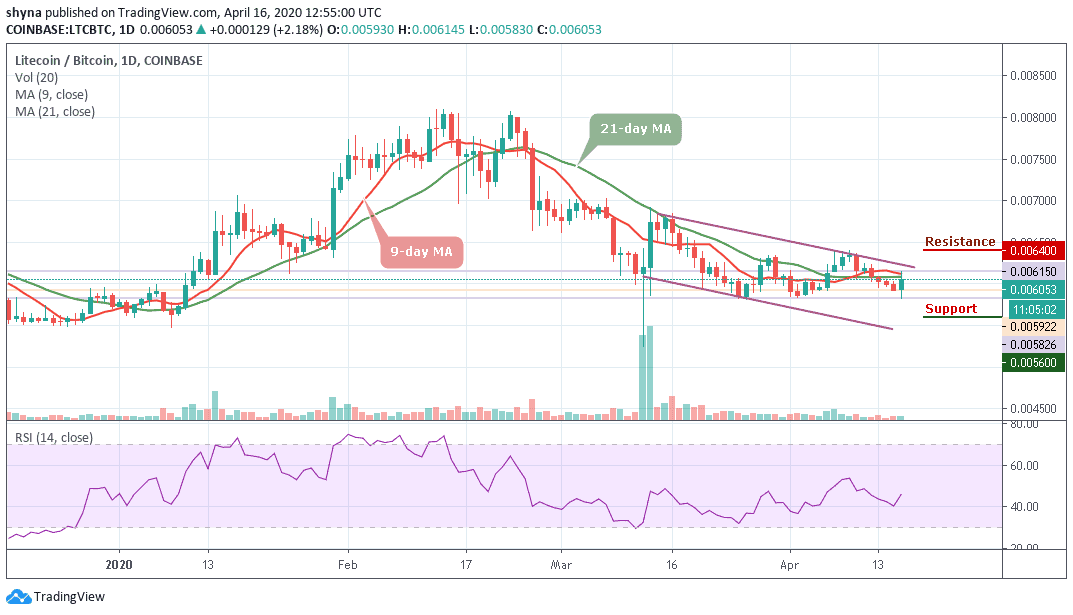
After dropping to $37.92 today, LTC/USD bounced and quickly recovered back above $40 level, the support that got broken a few hours ago. Looking at the daily chart, the Litecoin (LTC) is trading around $42 against the US Dollar. A climb above the previous resistance level at $43.82 could allow the bulls to regain control and move the price above the 9-day and 21-day moving averages. But looking at the current price setups, the bears may still be in play, if the pair refused to cross above the moving averages.
However, as stated above, LTC/USD is recovering back towards the previous resistance at $43. An increase above this initial resistance could trigger intense buying to $54, $56 and $58 resistance levels. In other words, looking at the downside, the Litecoin price may likely hold support level at $37.9 which is the current daily low. Therefore, if the Litecoin price drops below this support level, it may likely hit the closest support at $32.5.
Meanwhile, the next support after this is located at $28 where it may even dip to $26 and $24 supports if the selling volume keeps increasing. Nevertheless, the technical indicator RSI (14) reveals that the market may continue to follow the bullish movement if the signal line crosses above the 50-level.
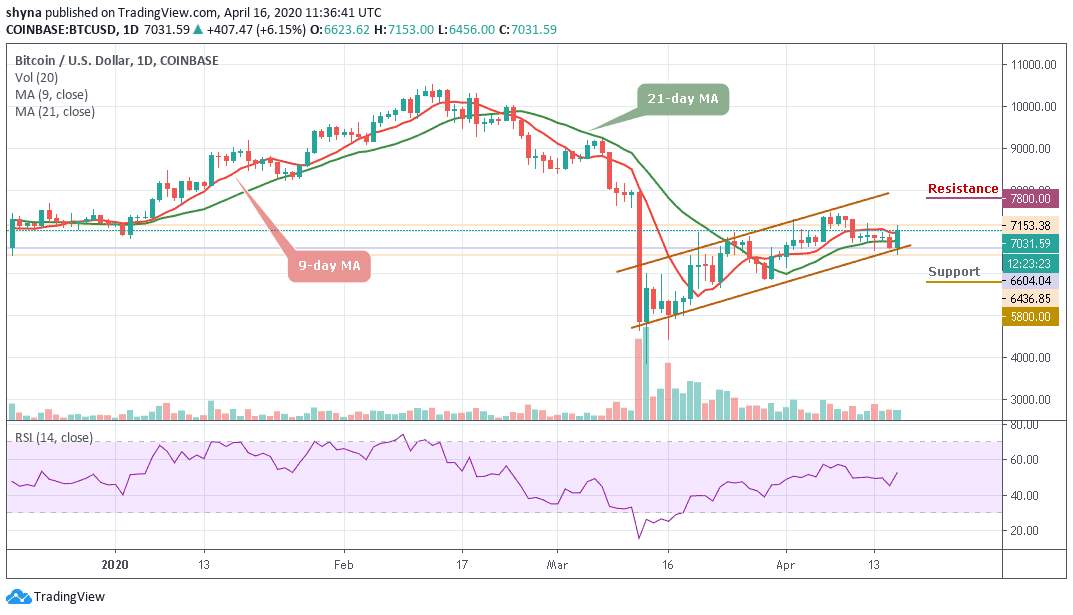
Comparing with Bitcoin, the buyers are about to step back into the market while the coin is trying to show some promising signs that could make higher highs if it continues to move towards the 9-day and 21-day moving averages. Meanwhile, from the upside, the nearest level of resistance lies at 6200 SAT and above this, higher resistance lies at 6400 SAT and 6600 SAT.
However, looking at the downside; the nearest level of support is 5900 SAT and beneath this, further support lies at 5800 SAT. If the price drops further to create a new low, lower support is therefore located at 5600 SAT and 5400 SAT respectively. The RSI (14) is moving around the 45-level which shows that the bulls may come into focus.
Please note: Insidebitcoins.com is not a financial advisor. Do your research before investing your funds in any financial asset or presented product or event. We are not responsible for your investing results.
Join Our Telegram channel to stay up to date on breaking news coverage