Join Our Telegram channel to stay up to date on breaking news coverage
LTC Price Prediction – March 21
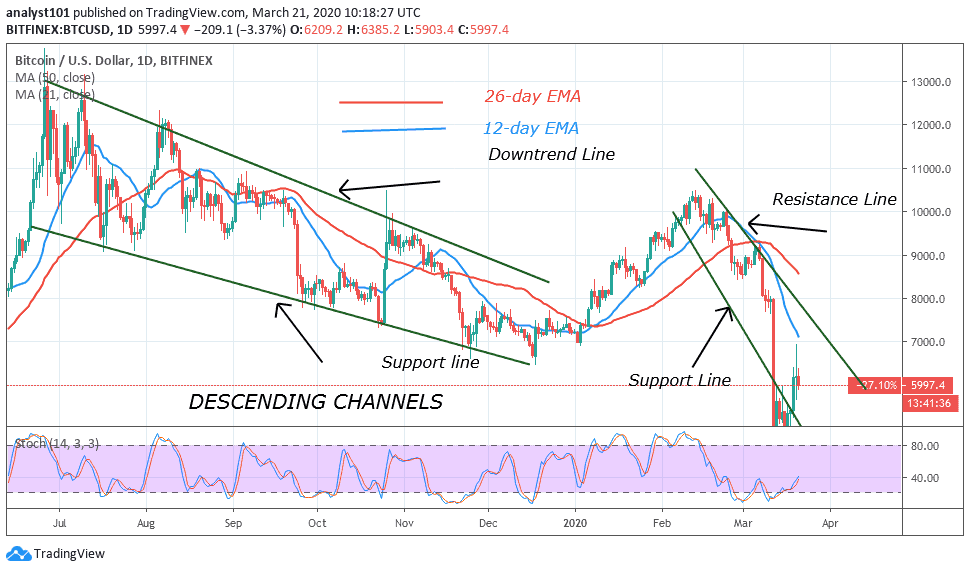
Litecoin (LTC) saw a sharp price decline of around 2.6% at the time that the market opens and it currently trades at $37.10.
LTC/USD Market
Key Levels:
Resistance levels: $52, $54, $56
Support levels: $26, $24, $22
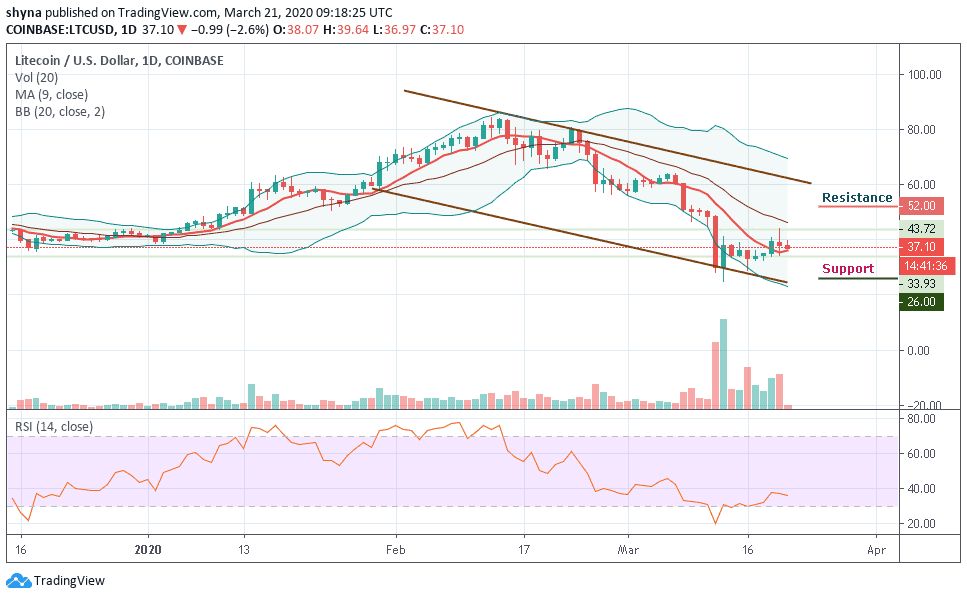
LTC/USD is currently losing nearly 2.6% as the market opened today amid global correction on the cryptocurrency market. Litecoin (LTC), which is the seventh-largest digital cryptocurrency in the world with the current trading volume of $2.39 billion, LTC/USD is changing hands at $37.10, off yesterday’s high registered at $43.72. The coin may settle below the 9-day moving average at $35, which now serves as an initial support level.
However, if the nearest support of $35 gives way, the sell-off may come to play and it may be extended towards the psychological $33 and also $31. At the moment, the bearish scenario may be more dominant if sellers continue to post firm commitment as the RSI (14) is now showing a downward trend, indicating the latest selling pressure on the market.
More so, we could see a sharp drop in support of $30 and $28. Breaking the aforementioned supports could further weaken the market to $26, $24 and $22. In other words, a higher possible swing may likely retest the previous resistance levels at $46 and $48. Meanwhile, if the buyers manage to fuel the market more, traders may expect a further increase to $52, $54 and $56 resistance levels.
When compared with Bitcoin, LTC is still following the downward movement, as the coin recently exploded under the solid support of 6000 SAT and continued to fall towards the 5957 SAT. The critical support level is located below the 9-day moving average at level 5700 SAT and below.
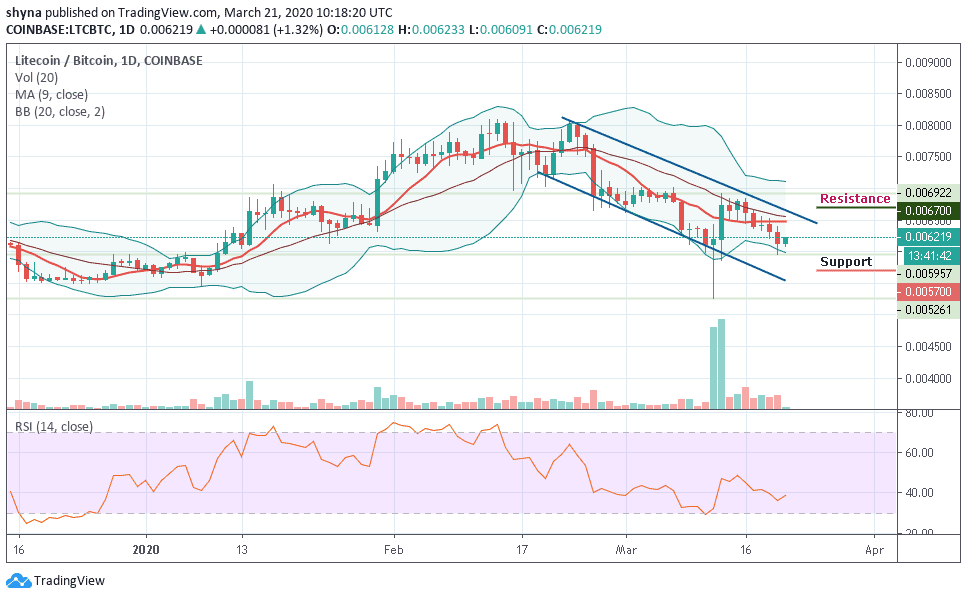
However, any attempt by the bulls to re-power the market, the coin can likely cross the moving average and the lower boundary of the channel to reach the resistance level at 6700 SAT and above. Meanwhile, the price of Litecoin is currently changing hands to 6219 SAT as the RSI (14) moves above 37-level.
Please note: Insidebitcoins.com is not a financial advisor. Do your research before investing your funds in any financial asset or presented product or event. We are not responsible for your investing results.
Join Our Telegram channel to stay up to date on breaking news coverage