Join Our Telegram channel to stay up to date on breaking news coverage
Litecoin Price Prediction – December 19
The Litecoin price prediction reveals that the slight bullish movement for the Litecoin (LTC) is still intact.
LTC/USD Market
Key Levels:
Resistance levels: $185, $195, $205
Support levels: $120, $110, $100
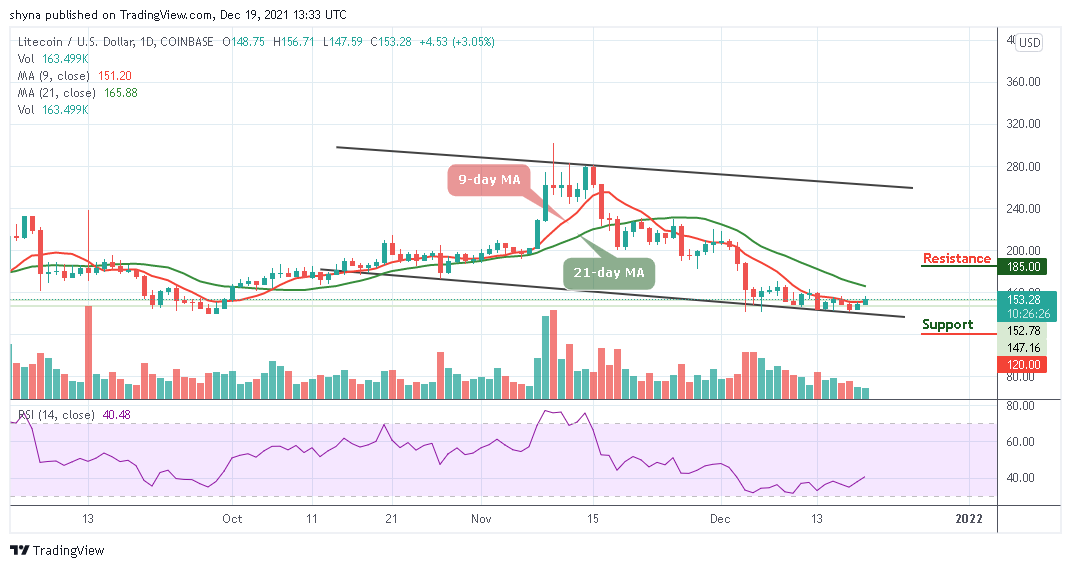
LTC/USD is ranging below the 9-day and 21-day moving averages. However, the Litecoin price is currently hovering at $153.28 after the bears took it to touch the daily low of $156.71. However, an early trading session towards the $160 level failed to generate sustainable gains, with the Litecoin price slipping back below the resistance level of $155.
Litecoin Price Prediction: Litecoin (LTC) Needs to Stay Above $150 Level
According to the daily chart, the longer the Litecoin price fails to rally from current trading levels, the greater the chance that we may see the Litecoin price falling below the 9-day and 21-day moving averages. However, a break below the $155 level may provoke the current movement and cause the market to decline towards the $120, $110, and $100 support levels.
However, the current movement reveals that the Litecoin price may face upward movement if the 9-day MA crosses above the 21-day MA. More so, the daily chart also reveals that LTC/USD needs to break the technical region of the $160 level which is above the 9-day moving average which may cause the coin to cross the 21-day moving averages and reach the potential resistance levels of $185, $195, and $205. Nevertheless, the technical indicator Relative Strength Index (14) is likely to cross above 50-level, which shows that the market may still follow an upward movement.
Against Bitcoin, the Litecoin price is currently trading at 3266 SAT as the market price is seen within the 9-day and 21-day moving averages. However, the bullish structure may not come to play now but the price has been moving sideways since a few days ago.
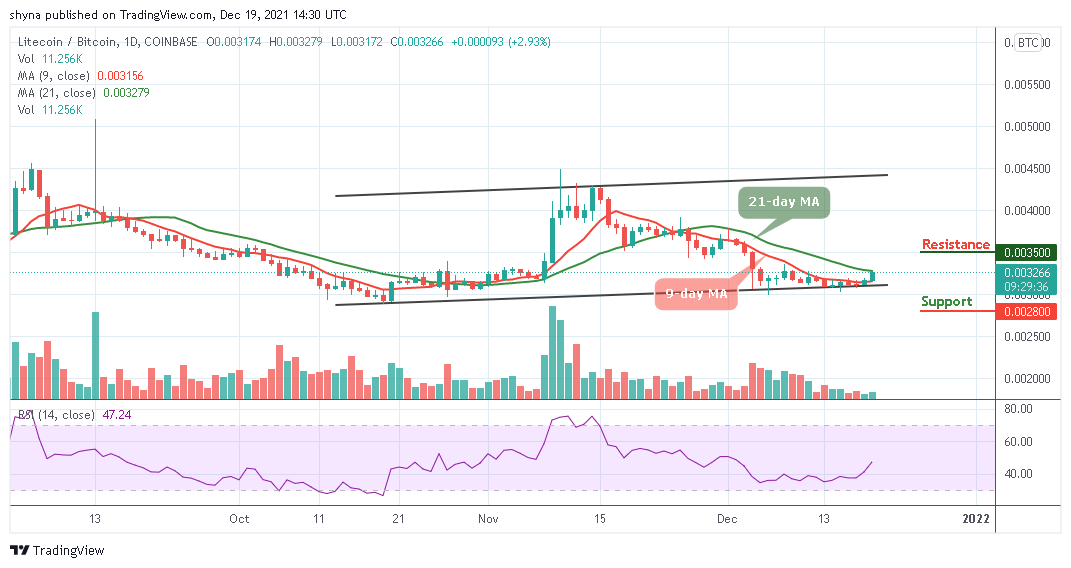
Meanwhile, the technical indicator Relative Strength Index (14) is likely to cross above 50-level, which could add more bullish signals into the market. Therefore, until the price either breaks out above the 21-day MA or slide below the 9-day MA, the direction of the trend is yet to be known. Moreover, if the coin moves to the upside and crosses above the moving averages, it could reach the potential resistance level of 3500 SAT and above while the support remains at 2800 SAT and below.
Looking to buy or trade Litecoin (LTC) now? Invest at eToro!
68% of retail investor accounts lose money when trading CFDs with this provider
Join Our Telegram channel to stay up to date on breaking news coverage