Join Our Telegram channel to stay up to date on breaking news coverage
LTC Price Prediction – February 4
LTC/USD price is moving in the downward trend within the channel, with a loss of 3.59% today.
LTC/USD Market
Key Levels:
Resistance levels: $75, $77, $79
Support levels: $60, $58, $56
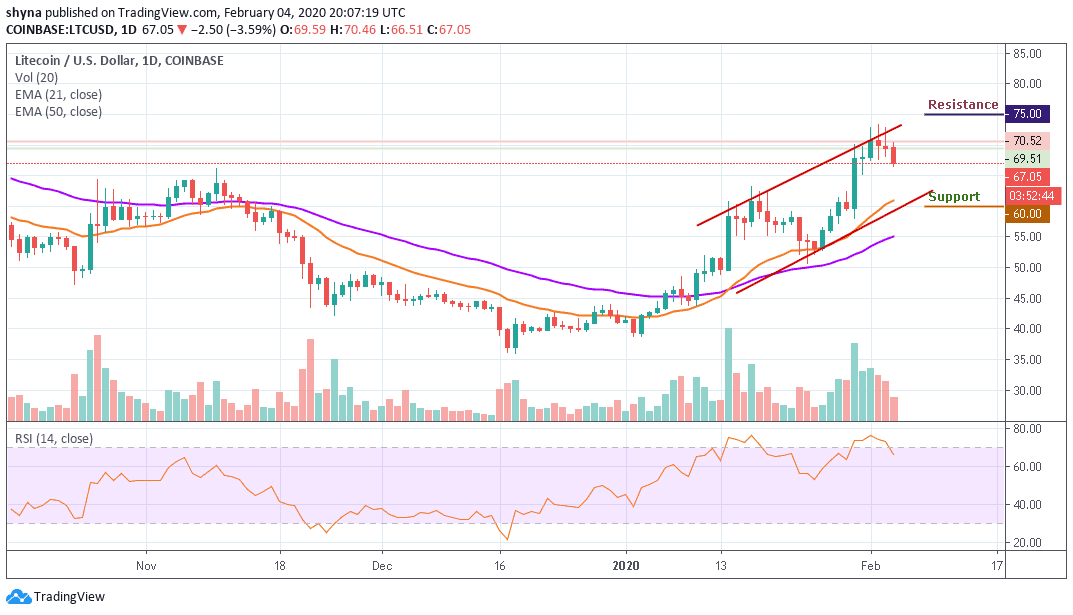
Looking at the daily chart, LTC/USD is still defending the support level of $65 again as the price hovers around $66. Meanwhile, the coin is moving above the 21 and 50 periods EMA and the market price is trading within the channel while the RSI (14) indicator may be issuing some bearish signals as it recovers from the overbought zone.
Moreover, the LTC/USD is yet to show a strong bear dominance in the market. But the short-term outlook looks bullishly strong. However, a bullish interception may set the next key resistance at $75, $77, and $79, crossing the upper boundary. Nevertheless, traders could experience a little rise before the rally begins.
Following the on-going movement, the price of Litecoin has recently plunged to $67 and a small rise could take it to $68. A further rally may come to play at $60, $58 with a possible new monthly low at $56. As we can see on the daily price chart, LTC volume is becoming low over the past days, which shows the bears may soon step back into the market.
Comparing LTC with BTC, the daily chart reveals that the pair has eventually broken solid support at 7400 SAT. Litecoin price may see another sharp drop at 7200 SAT support level. Breaking this level could further take the price to the critical support levels at 6800 SAT and 6600 SAT around the 21 and 50 periods of EMA.
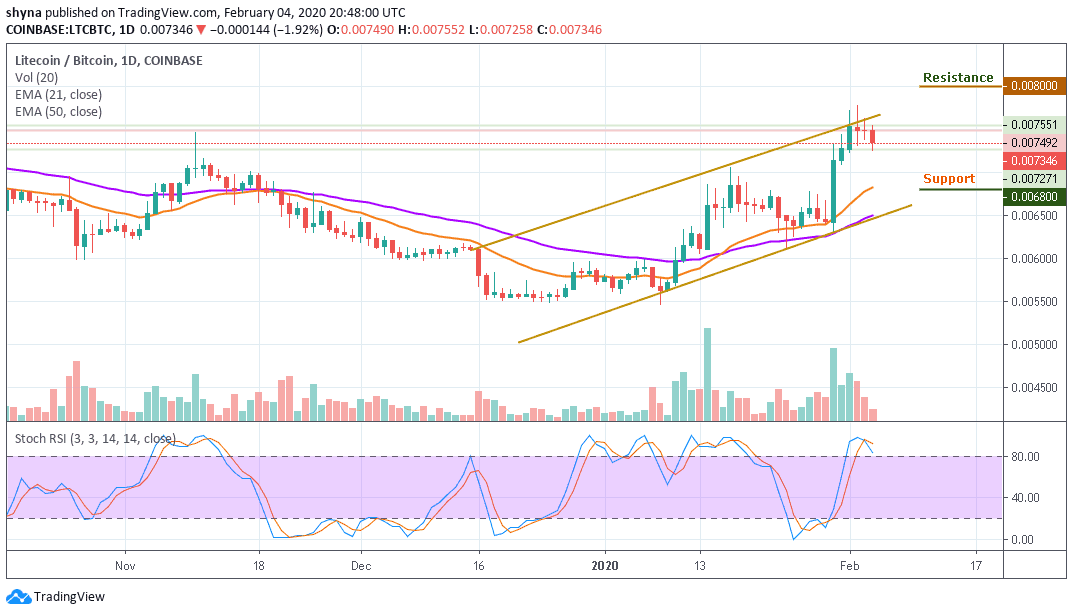
However, the Litecoin price is trading at the 7346 SAT level, if the bulls can hold the price as it is and move the market upward, the next key targets for the bulls lie at 7,600 SAT and 7,800 SAT respectively. Reaching these levels might take it to the potential resistance levels of 8,000 SAT and 8,200 SAT. Meanwhile, the stochastic RSI is extremely at the overbought zone, indicating a bearish movement for LTC/BTC.
Please note: Insidebitcoins.com is not a financial advisor. Do your research before investing your funds in any financial asset or presented product or event. We are not responsible for your investing results.
Join Our Telegram channel to stay up to date on breaking news coverage