Join Our Telegram channel to stay up to date on breaking news coverage
LTC Price Prediction – December 2
LTC/USD price has moved downward after falling from its range amid strong bearish sentiments. The initial support is located on the approach to psychological $43.
LTC/USD Market
Key Levels:
Resistance levels: $52, $54, $56
Support levels: $40, $38, $36

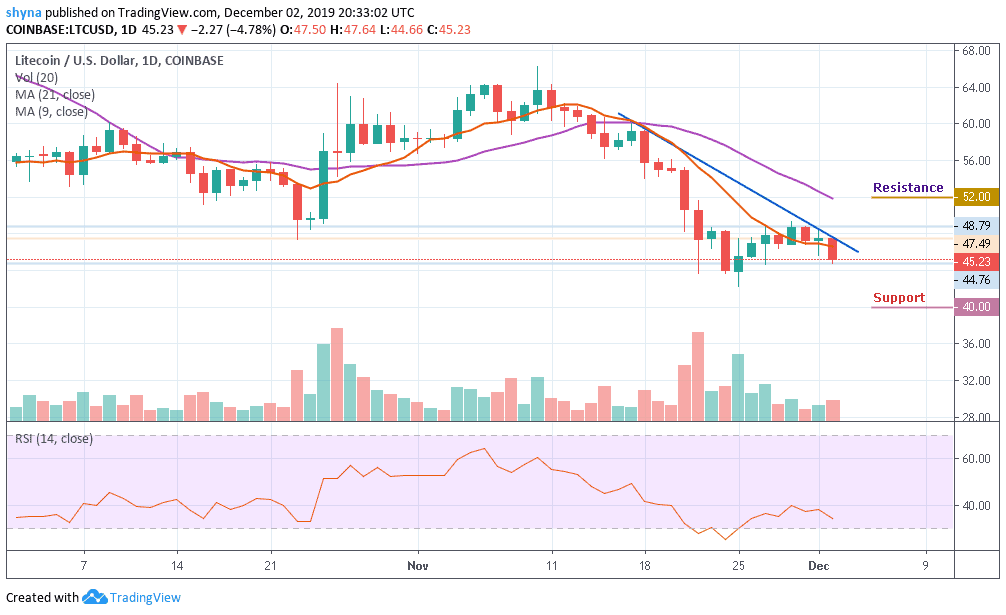
As the market opens today, the LTC/USD price was observed following a bearish movement below the 21-day moving average. For a month, the crypto has at least kept the price above $48. On the upside, the market movement still remained under $50. Locking operations in the last 3 weeks were dull and offered little trading activities. Despite this, the broken support of the price shows the formation of a lower low trend which gave an indication that the bears were largely under control.
Meanwhile, LTC/USD could not avoid the bearish wave that ranged the market on November 21 – 23. This painful downward trend exerted intense pressure on key support established above $45. More so, the declines devastated the support zone and pushed the coin to less than $43. A low formed just above $42 was replaced by a shallow correction that failed to correct above $45.
Nevertheless, the crypto is currently trading at $45.23 after losing 4.78% of its value. The RSI (14) is heading towards the oversold zone, which shows that an immense bearish pressure may continue to weigh on the support at $44 and that we could witness further declines at support levels of $40, $38 and $36. Looking at the daily chart, we can see that LTC/USD is still sitting at $45. If the price level can be maintained, we could see a buyback with $48 resistance before getting to the resistance levels of $52, $54 and $56.
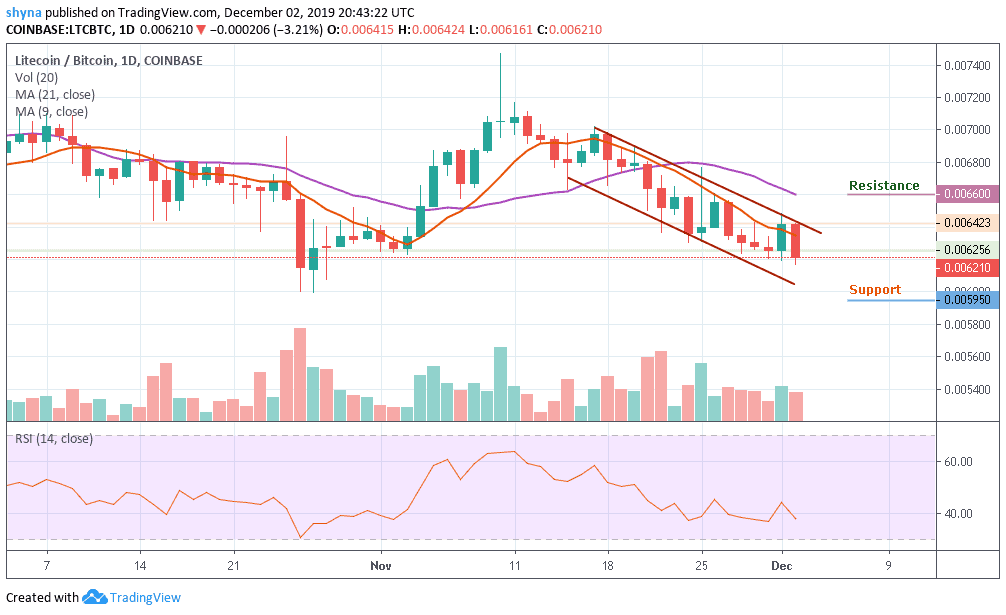
Comparing with Bitcoin, LTC performance has been very low due to a recurring Against BTC, the pair has already dropped below the moving averages of 9 and 21 days before falling back to break solid support of 6200 SAT. The Litecoin (LTC) price may likely see another sharp drop at 6000 SAT support level. Breaking this level could further drag the market to the nearest support levels at 5950 SAT, 5850 SAT, and 5750 SAT.

However, LTC is currently changing hands at 6201 SAT and if the bulls can hold the price tight as it is, the next key target price lies at 6600 SAT and 6800 SAT respectively. Reaching these levels might move it to 5900 SAT. Meanwhile, the RSI (14) nosedive below the 40-level; possible selling pressure is likely if it continues like this.
Please note: Insidebitcoins.com is not a financial advisor. Do your research before investing your funds in any financial asset or presented product or event. We are not responsible for your investing results.
Join Our Telegram channel to stay up to date on breaking news coverage


