Join Our Telegram channel to stay up to date on breaking news coverage
Litecoin Price Prediction – December 24
The Litecoin price prediction shows the coin making a comeback within the channel as its sell-offs may be extended further.
LTC/USD Market
Key Levels:
Resistance levels: $200, $210, $220
Support levels: $120, $110, $100
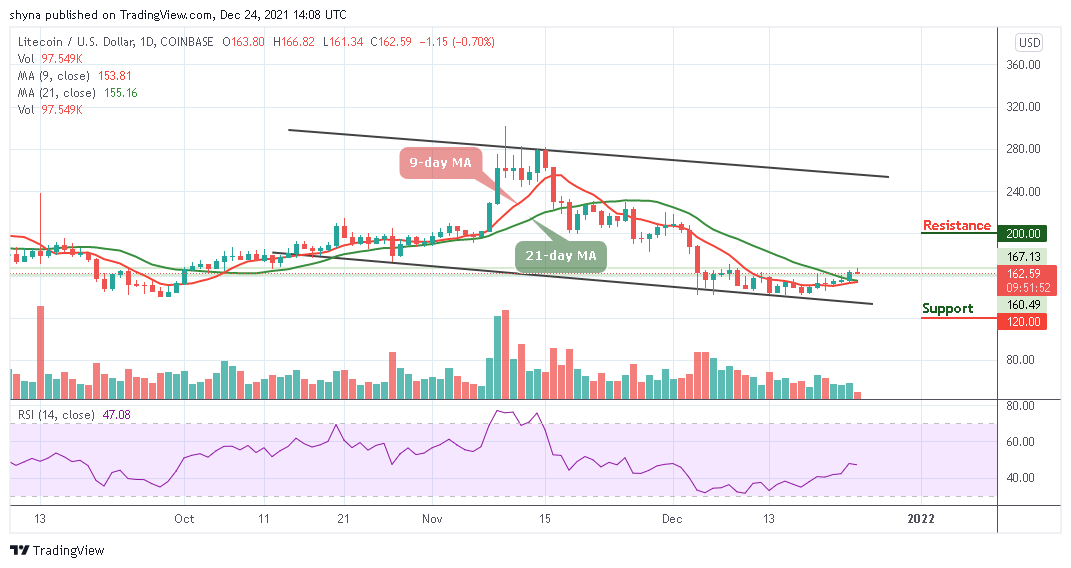
LTC/USD is currently changing hands at $162.59, down from the recent high of $166.82 that was attained during the European session today. The Litecoin price is moving synchronously above the 9-day and 21-day moving averages on the market and it is mainly influenced by speculative sentiment and technical factors, while the coin is likely to follow a sideways movement in the coming session.
Litecoin Price Prediction: Would Litecoin (LTC) Move to the Downside?
As the daily chart reveals, the Litecoin price is likely to cross below the moving averages as bulls failed to hold the ground. The widespread retracement on the market could push the coin below the moving averages with the next local support located at $150. Meanwhile, this level is likely to limit the correction and serve as a jumping-off ground for another bullish wave.
However, if the coin begin to drop, it is likely for the sell-off to gain traction with the next focus on $120, $110, and $100 support levels. On the upside, the initial resistance may be created towards the upper boundary of the channel at $170 level and traders may need to see a sustainable move to the upside. The further bullish movement could touch the $200, $210, and $220 resistance levels. On the contrary, the technical indicator Relative Strength Index (14) is moving below 50-level, suggesting more bearish signals.
When compares with Bitcoin, the Litecoin price continues to experience a tremendous downtrend, as the coin moves around the 9-day and 21-day moving averages. The bulls have not been able to push the market above the moving averages as the technical indicator Relative Strength Index (14) keeps heading to the south.
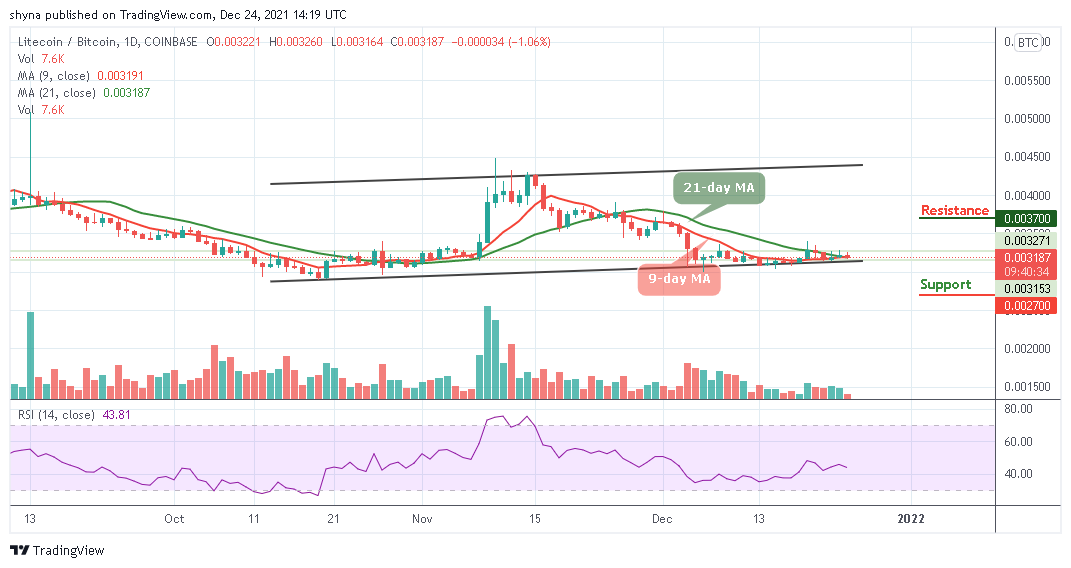
However, the critical support level could be located at 2700 SAT and below. Moreover, if bulls begin to power the market, the coin may likely break above the 9-day and 21-day moving averages to find the potential resistance level at 3700 SAT and above.
Looking to buy or trade Litecoin (LTC) now? Invest at eToro!
68% of retail investor accounts lose money when trading CFDs with this provider
Join Our Telegram channel to stay up to date on breaking news coverage