Join Our Telegram channel to stay up to date on breaking news coverage
Litecoin Price Prediction – February 26
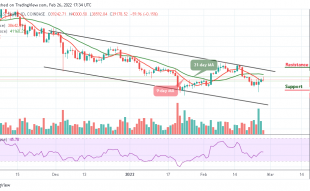
The Litecoin price prediction shows the coin moving down within the channel as its sell-offs may be extended further.
LTC/USD Market
Key Levels:
Resistance levels: $150, $160, $170
Support levels: $70, $60, $50
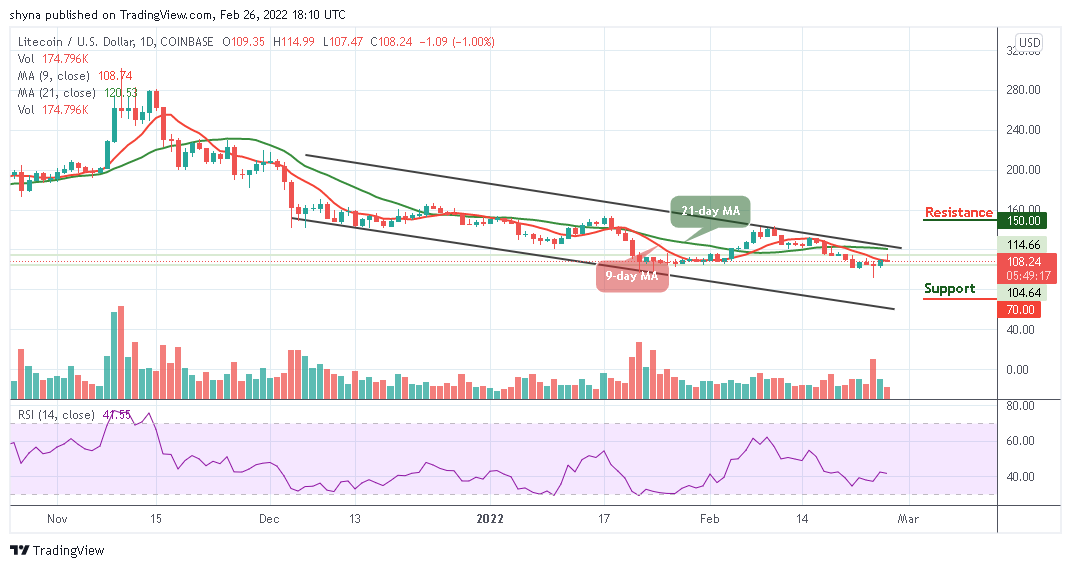
LTC/USD is currently changing hands at $108.24, down from the recent high of $114.99 that the coin touched some few hours ago. The Litecoin price is moving synchronously around the 9-day moving average on the market and it is likely for the coin to cross below this barrier and face the downside.
Litecoin Price Prediction: What Would be the Fate of Litecoin (LTC)?
According to the daily chart, the Litecoin price is likely to cross below the 9-day moving average as bulls failed to hold the ground. However, the widespread retracement on the market could push the coin towards the lower boundary of the channel with the next local support located at $95. Meanwhile, this level is likely to limit the correction and serve as a jumping-off ground for another bullish wave.
However, if the coin drops more, it is likely for the sell-off to gain traction with the next focus on $70, $60, and $50 support levels. On the upside, the initial resistance may be created at $120 and traders may need to see a sustainable move above the upper boundary of the channel to test $140. The further bullish movement could touch the resistance levels of $150, $160, and $170 respectively. The technical indicator Relative Strength Index (14) is likely to cross below 40-level, to suggest more bearish signals.
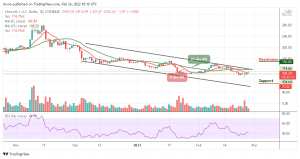
Against Bitcoin, the Litecoin price continues to experience a serious downtrend, as the coin remains below the 9-day and 21-day moving averages. The bulls have not been able to push the market above the moving averages as the technical indicator Relative Strength Index (14) remains below 40-level.
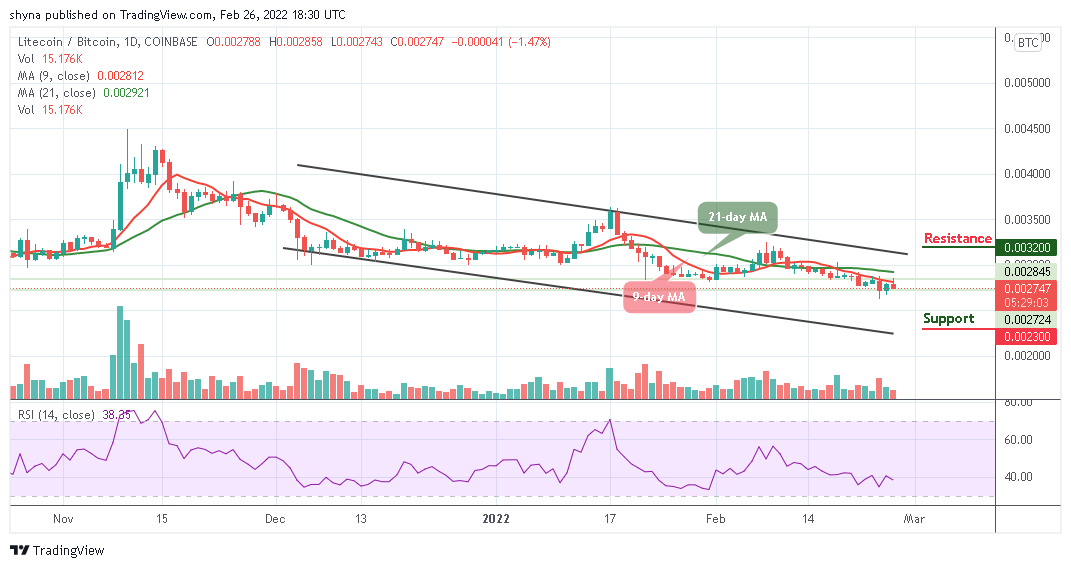
However, the critical support level could be located at 2300 SAT and below, but if the bulls begin to power the market, the coin may break above the 9-day and 21-day moving averages to locate the potential resistance level at 3200 SAT and above after crossing the upper boundary of the channel.
Looking to buy or trade Litecoin (LTC) now? Invest at eToro!
68% of retail investor accounts lose money when trading CFDs with this provider
Join Our Telegram channel to stay up to date on breaking news coverage