Join Our Telegram channel to stay up to date on breaking news coverage
Litecoin Price Prediction – July 31
The Litecoin price prediction witnesses a drop today, amounting to a 1.79% loss with a current trading price of around $143.01.
LTC/USD Market
Key Levels:
Resistance levels: $165, $175, $185
Support levels: $115, $105, $95
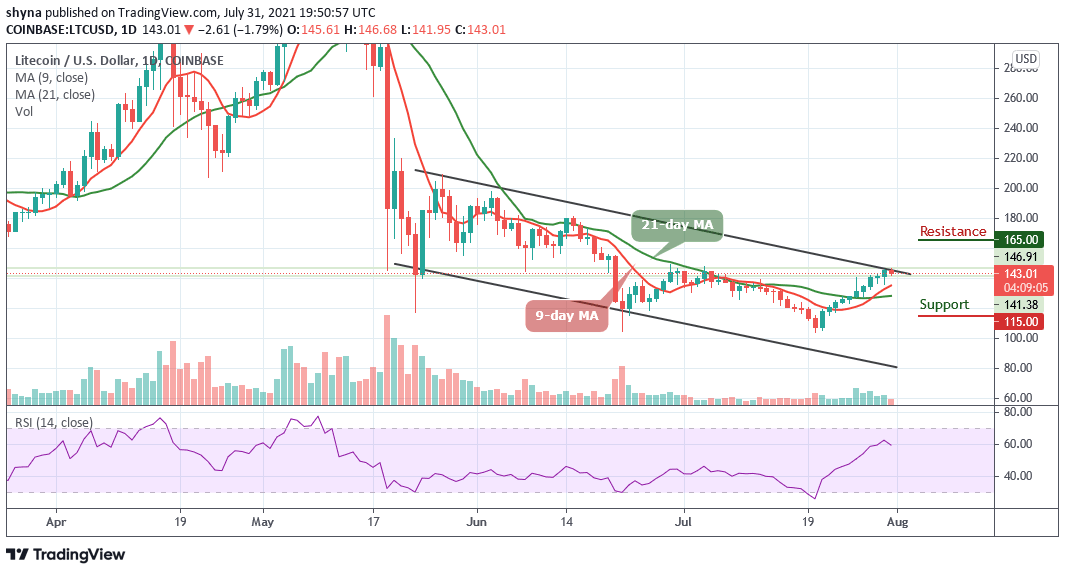
LTC/USD drops by 1.79% over the past 24 hours of trading as the coin stays below the upper boundary of the channel to reach the daily low of $141.95 level. However, it seems that the bullish momentum is fading quickly as the technical indicator Relative Strength Index (14) plummets below the 60-level. A break beneath this level may cause the coin to follow the downtrend as the bears may take control of the market momentum.
Litecoin Price Prediction: Litecoin Price May Not Drop Further
As the coin moves within the channel, the Litecoin price fails to rally from the current trading levels the traders may see the cryptocurrency falling to another trading low. Meanwhile, a break below the 9-day and 21-day moving averages may provoke a quick decline towards the supports at$115, $105, and $95 respectively.
However, a break above the upper boundary of the channel may propel the price of Litecoin to move towards the potential resistance levels of $165, $175, and $185. Meanwhile, the technical indicator Relative Strength Index (14) is currently facing the south as the signal line continues to face a downtrend which could cause the market to experience more negative signs.
When compares with BTC, the Litecoin price is following a bearish movement below the 9-day and 21-day moving averages. The cryptocurrency on the market cap is finding its way toward the lower boundary of the channel because the market movement has remained clouded by more red candles.
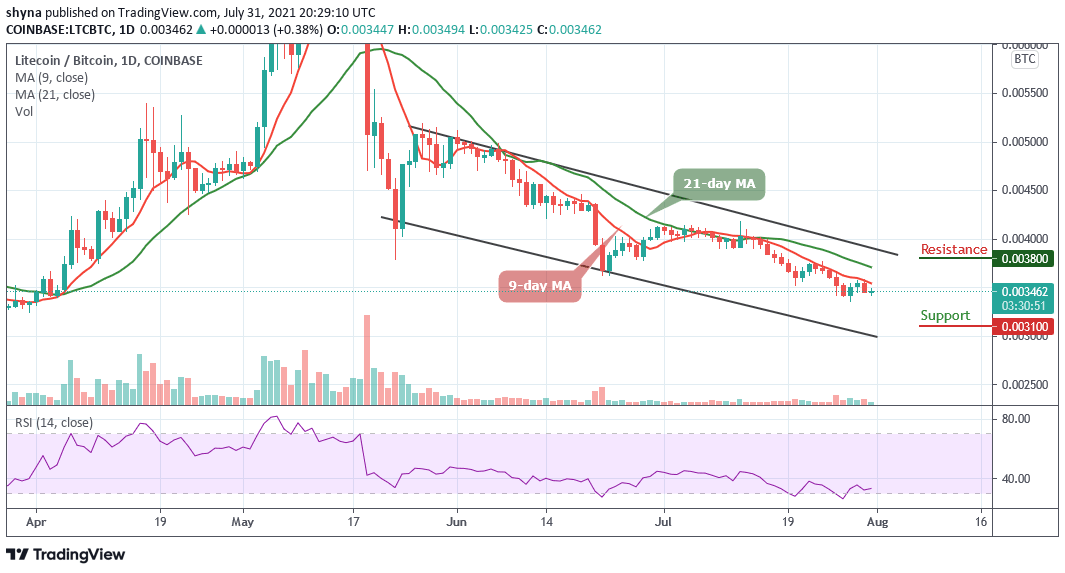
However, as the technical indicator Relative Strength Index (14) moves at the downside, a bearish continuation may likely roll the market to the support of 3400 SAT with a possible break below the channel. A further decline could be at 3100 SAT and below, which may establish an additional low for the market. Meanwhile, any bullish movement above the upper boundary of the channel may hit the resistance level of 3800 SAT and above.
Looking to buy or trade Litecoin (LTC) now? Invest at eToro!
75% of retail investor accounts lose money when trading CFDs with this provider
Join Our Telegram channel to stay up to date on breaking news coverage