Join Our Telegram channel to stay up to date on breaking news coverage
Litecoin Price Prediction – December 17
The Litecoin price prediction reveals that LTC could not climb above the $150 level as the coin heads southward.
LTC/USD Market
Key Levels:
Resistance levels: $185, $195, $205
Support levels: $120, $110, $100
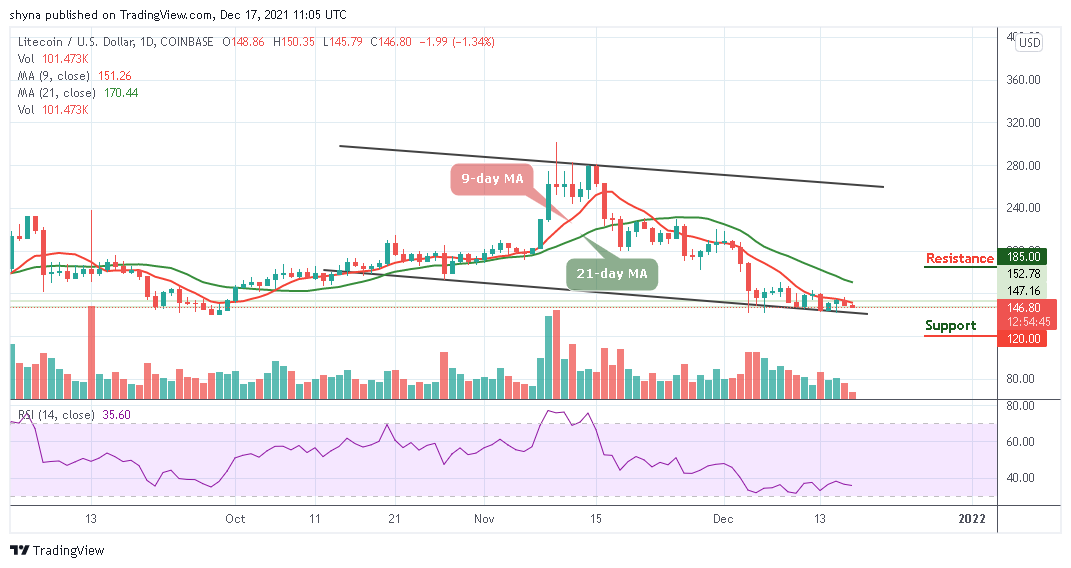
Despite an uptick in other cryptos, LTC/USD is currently struggling to gather momentum above the $150 level. According to the daily chart, the Litecoin price remains below the 9-day and 21-day moving averages, but if it break below the support level of $145, it may likely slump below the lower boundary of the channel.
Litecoin Price Prediction: Litecoin (LTC) May Slump Lower
The Litecoin price is currently moving sideways. However, if the market price slides below the lower boundary of the channel, it may continue to experience a period of bearish momentum and it could target the $130 support level before critically looking towards the support levels of $120, $110, and $100. Meanwhile, for that not to happen, the bulls would need to push the coin above the moving averages.
More so, if Litecoin (LTC) breaks above $155 resistance level, it may likely face a bullish movement with higher highs and higher lows. Should in case the price decides to maintain the bullish movement above the 21-day moving average, the coin may likely find the potential resistance at $185, $195, and $205. In other words, the technical indicator Relative Strength Index (14) is suggesting a sideways movement for the market as the signal remains below 40-level.
When compares with Bitcoin, the Litecoin price is also following a sideways movement, trading under the 9-day and 21-day moving averages within the channel. However, if the bulls attempt to gain momentum, the bears are likely to release a slight pressure on the market as the technical indicator Relative Strength Index (14) may move towards the oversold zone.
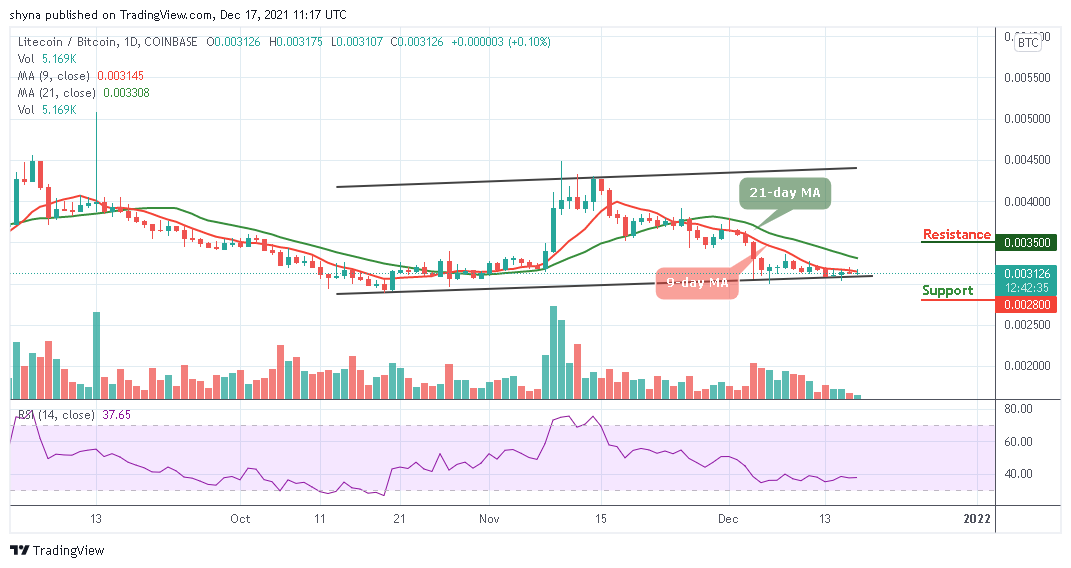
However, if the Litecoin falls below the lower boundary of the channel, it may likely hit the nearest support at 3000 SAT. Any further negative movement could significantly lower the price to 2800 SAT and below. In case of a rebound, the coin may cross above the moving averages to touch the nearest resistance level of 3400 SAT. If the bulls manage to stay well above this level, traders could see the coin reaching the potential resistance level of 3500 SAT and above.
Looking to buy or trade Litecoin (LTC) now? Invest at eToro!
68% of retail investor accounts lose money when trading CFDs with this provider
Join Our Telegram channel to stay up to date on breaking news coverage