Join Our Telegram channel to stay up to date on breaking news coverage
LTC Price Prediction – January 9
LTC/USD is moving in sync with the rest of the cryptocurrency market and the coin may find support on approach to $43.
LTC/USD Market
Key Levels:
Resistance levels: $50, $52, $54
Support levels: $40, $38, $36
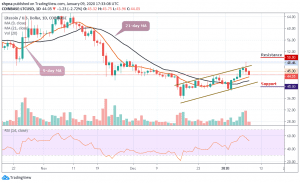
Litecoin (LTC), which is the sixth-largest digital cryptocurrency in the world with the current trading volume of $2.9 billion, lost nearly 2.08% as the market opened today amid global correction on the cryptocurrency market. LTC/USD is changing hands at $44.05, off yesterday’s high registered at $48.46. The coin may settle below the 9-day moving average at $43, which now serves as an initial support level.
However, if the nearest support of $43 gives way, the sell-off may come to play and it may be extended towards the psychological $42 and also below the 21-day moving average at $41. At the moment, the bearish scenario is even more dominant as sellers continue to post firm commitments. We could see a sharp drop in support of $42 and $41. Breaking the aforementioned supports could further weaken the market to $40, $38 and $36.
In other words, a higher possible swing may likely retest the previous resistance levels at $46 and $48. However, if the bulls manage to fuel the market with the mentioned resistance levels, traders may expect a further increase to $50, $52 and $54 resistance levels. RSI (14) is now showing a downward trend, indicating the latest selling pressure on the market.
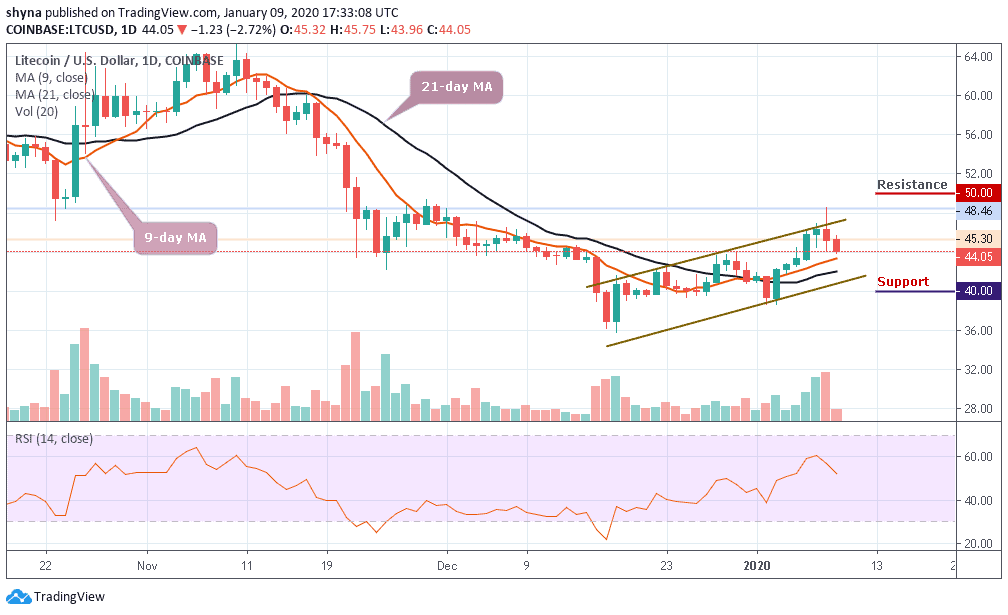
Against Bitcoin, the market has evolved for a while in a very different way. But currently, sellers and buyers are in a tug-of-war about who will dominate the market but currently moving under the 9-day and 21-day moving averages while the RSI (14) is suggesting a sideways movement.
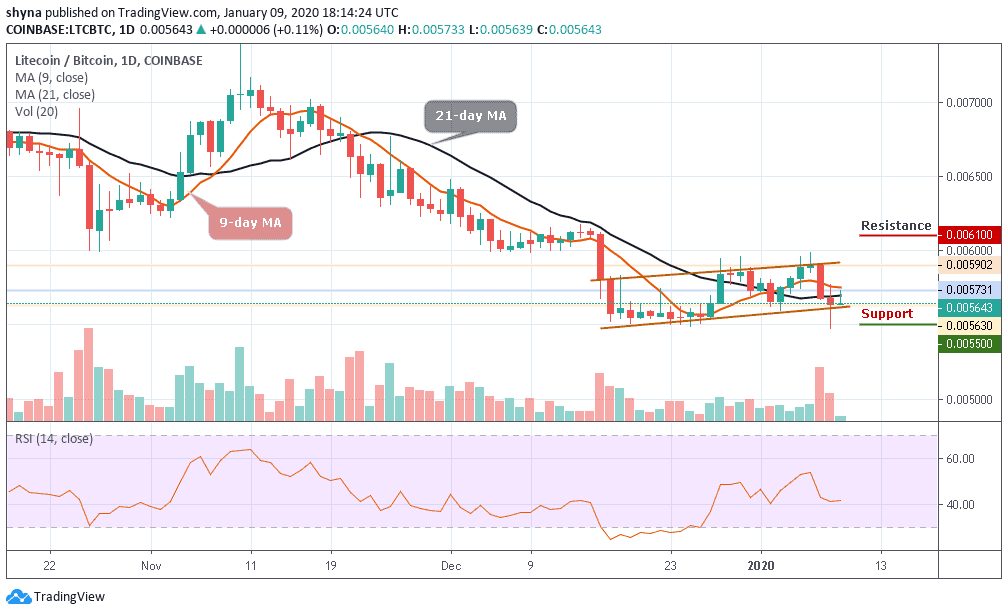
Looking at the daily chart, the bulls are making effort in building the confidence to increase their entries. More so, if the bulls succeed in the broken above the moving averages, one would expect the market to reach the resistance level of 6100 SAT and 6200 SAT. Meanwhile, a retest could bring it to 5500 SAT and 5400 SAT support levels.
Please note: Insidebitcoins.com is not a financial advisor. Do your research before investing your funds in any financial asset or presented product or event. We are not responsible for your investing results.
Join Our Telegram channel to stay up to date on breaking news coverage