Join Our Telegram channel to stay up to date on breaking news coverage
LTC Price Prediction – March 17
The Litecoin price may continue to settle in a range between $29 and $39 as the RSI (14) moves in the same direction above the oversold zone.
LTC/USD Market
Key Levels:
Resistance levels: $52, $54, $56
Support levels: $14, $12, $10
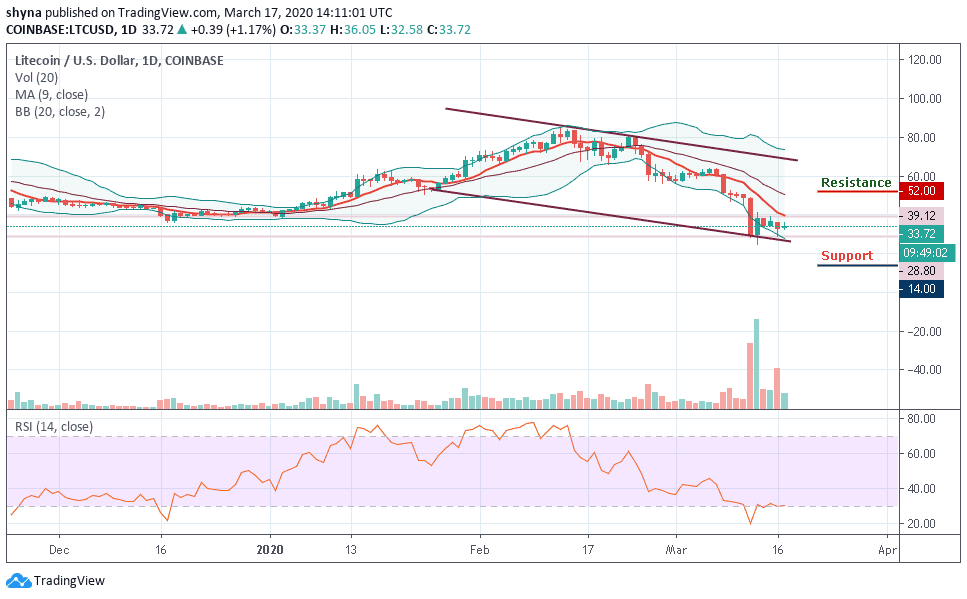
LTC/USD is still moving in sideways around the lower boundary of the Bollinger bands within the descending channel. In fact, the cryptocurrency is trading in its tightest four days trading band after the bears took over from the bulls. Today, an early trading session towards the $40 level failed to generate sustainable gains, with the LTC/USD pair slipping back under the $35 level.
However, the longer the pair fails to rally from current trading levels, the greater the chance that we may see the cryptocurrency falling below the 9-day moving average. A break below the $30 support level may provoke an even deeper decline towards the $14, $12 and $10 levels. Nonetheless, the short-term technical analysis reveals that the $20 and $25 levels are currently the strongest forms of technical support before the $30 level starts to come back into focus.
Moreover, the daily chart reveals that the LTC/USD needs to break the technical region of the $45 level which is above the 9-day moving average, so that the coin may likely reach the resistance levels of $52, $54 and $56. Meanwhile, the technical indicator RSI (14) is moving in the same direction above the oversold zone, which shows that the market is indecisive at the moment.
Against Bitcoin, LTC is still experiencing some difficulties, the coin recently exploded above the solid resistance of 6900 SAT and continued to fall towards the 6442 SAT. The critical support level is located below the 9-day moving average at level 6000 SAT and below.
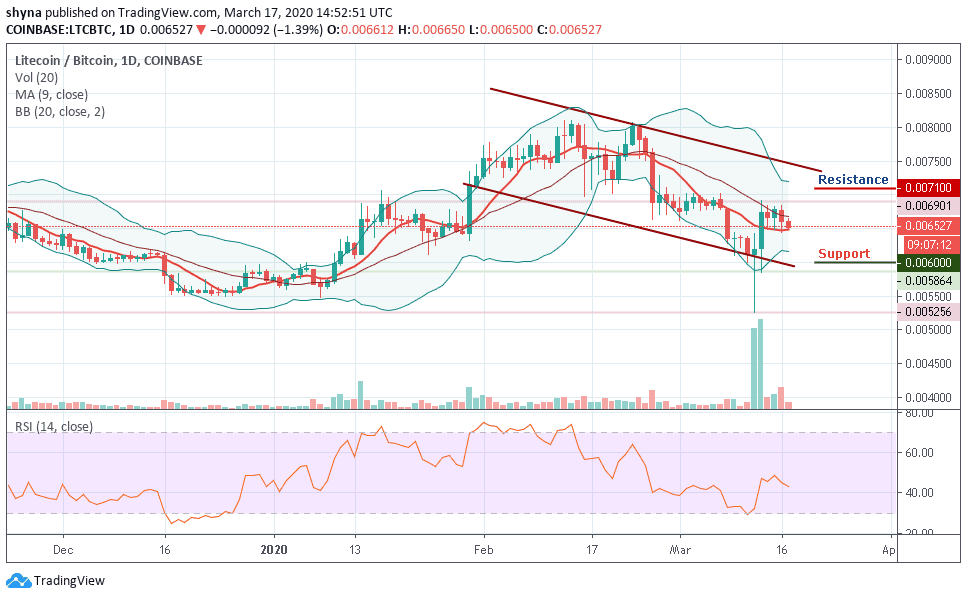
However, any attempt by the bulls to re-power the market, the coin may likely find the resistance level at 7100 SAT and above. Meanwhile, the price of Litecoin is currently changing hands at 6527 SAT and a spike in volatility could occur as the technical indicator RSI (14) moves below 45-level.
Please note: Insidebitcoins.com is not a financial advisor. Do your research before investing your funds in any financial asset or presented product or event. We are not responsible for your investing results.
Join Our Telegram channel to stay up to date on breaking news coverage