Join Our Telegram channel to stay up to date on breaking news coverage
LTC Price Prediction – April 4
LTC/USD is currently facing the ultimate breakout dilemma; would the breakout rally to $50 or a breakdown to $30?
LTC/USD Market
Key Levels:
Resistance levels: $50, $52, $54
Support levels: $30, $28, $26

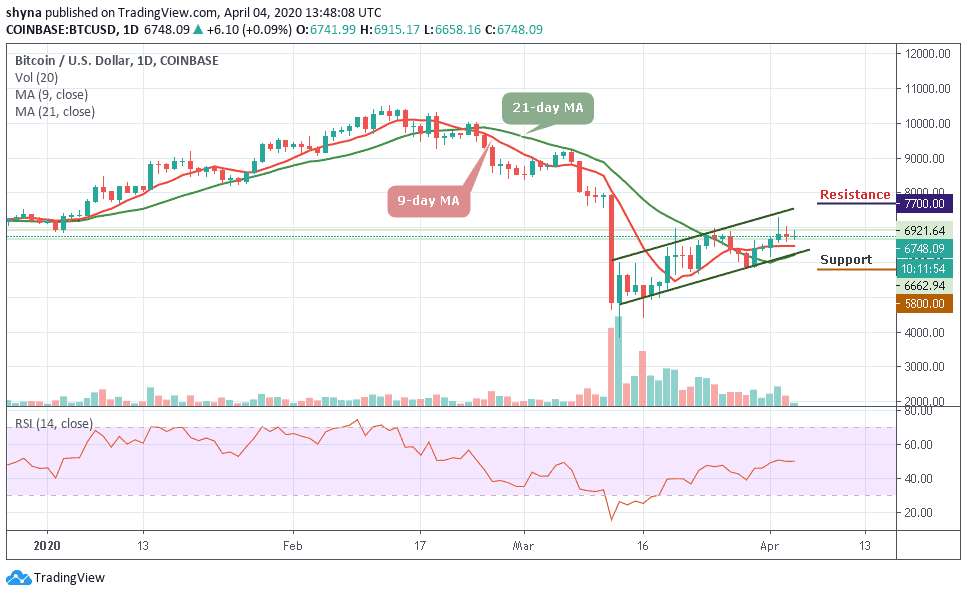
LTC/USD has mainly underperformed since recovery was staged from the lows posted a few weeks ago. While the price crash has been devastating for traders, the LTC/USD recovery has not occurred compared to other major cryptocurrencies in the market. On the other hand, Litecoin only succeeded in testing the resistance at $43 without much success.
Meanwhile, at the time of writing, LTC/USD is trading at $40.37 where the intraday bullish action may close in this range but may likely test the resistance level of $41 before the end of trading today. The price is also moving above the 9-day and 21-day MAs whose breakout could be the stepping stone for LTC rally above $50. However, the lack of a breakout above $45 could also result in another breakdown below the support towards $30 level.
In this case, it is now up to the bulls to decide which direction the price would take; will it be towards $50 or a return to $30? But the RSI (14) is seen moving horizontally around 45-level. This clearly shows that at present, selling pressure is equivalent to buying pressure.
Consequently, sideways action could possibly occupy a center stage in the form of consolidation. The resistance levels to watch are $50, $52 and $54 while the support levels lie at $30, $28 and $26 respectively.
Against BTC, the Litecoin price continues to follow the downtrend. For a trend reversal, there’s a need for an increase in volume to cause an upsurge in the market. Now, the coin is trading below the 9-day and 21-day moving average. We can expect close support at the 5700 SAT before breaking to 5550 SAT and critically 5350 SAT.
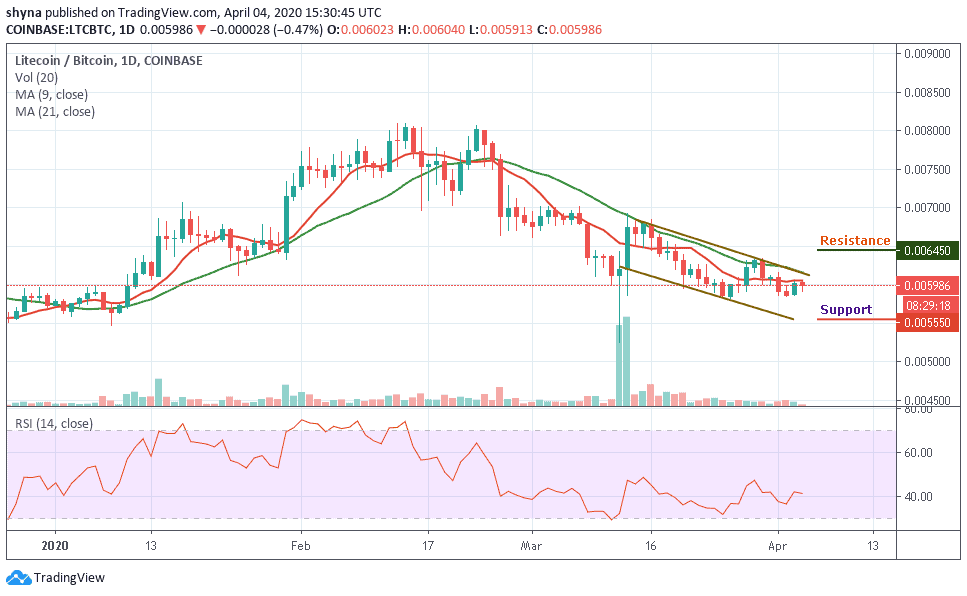
More so, there’s no sign of bullish move for the Litecoin market. However, if a bullish move occurs and validates a break significantly above the 9-day and 21-day MAs and hits the nearest resistance at 6200 SAT; we can then confirm a bull-run for the LTC/BTC pair. For now, the closest resistance lies at 6450 SAT and 6550 SAT.
Please note: Insidebitcoins.com is not a financial advisor. Do your research before investing your funds in any financial asset or presented product or event. We are not responsible for your investing results.
Join Our Telegram channel to stay up to date on breaking news coverage