Join Our Telegram channel to stay up to date on breaking news coverage
Litecoin Price Prediction – February 12
The Litecoin price is moving down synchronously within the market, and its sell-offs may be extended below the 21-day moving average.
LTC/USD Market
Key Levels:
Resistance levels: $170, $190, $210
Support levels: $80, $60, $40

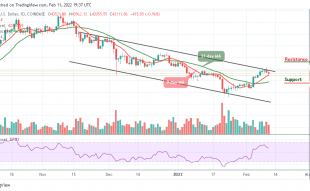
At the time of writing, LTC/USD is changing hands to $123.61, down from the opening trade at $125.66. The coin is moving synchronously below the 9-day moving average. The Litecoin price is mainly influenced by speculative sentiment and technical factors. However, the coin is known for its herd behavior, as everything rises and falls at the same time.
Litecoin Price Prediction: Litecoin (LTC) May Drop to the Downside
The Litecoin price moves below the opening price of $125.66 level as bulls couldn’t hold the ground. The widespread retracement on the market pushes the coin towards the 21-day moving average with the next local support created by $120. This level should limit the correction and serve as a starting point for another upward wave.
However, the sell-off is likely to gain traction with the next focus on $80, $60, and $40 support levels. Meanwhile, on the upside, the initial resistance is created above the moving averages at $150. Traders may need to see a sustainable move above this level to test $160. The further bullish movement could touch the $170, $190, and $210 resistance levels as the technical indicator Relative Strength Index (14) prepares to cross below 50-level, indicating bearish signals.
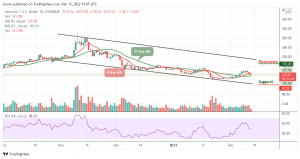
Against Bitcoin, the Litecoin price is moving sideways, as the coin remains below the 9-day and 21-day moving averages. However, the bulls attempt to push the coin above the moving averages, but the technical indicator Relative Strength Index (14) keeps ranging. However, the critical support level is located around the 2500 SAT and below.
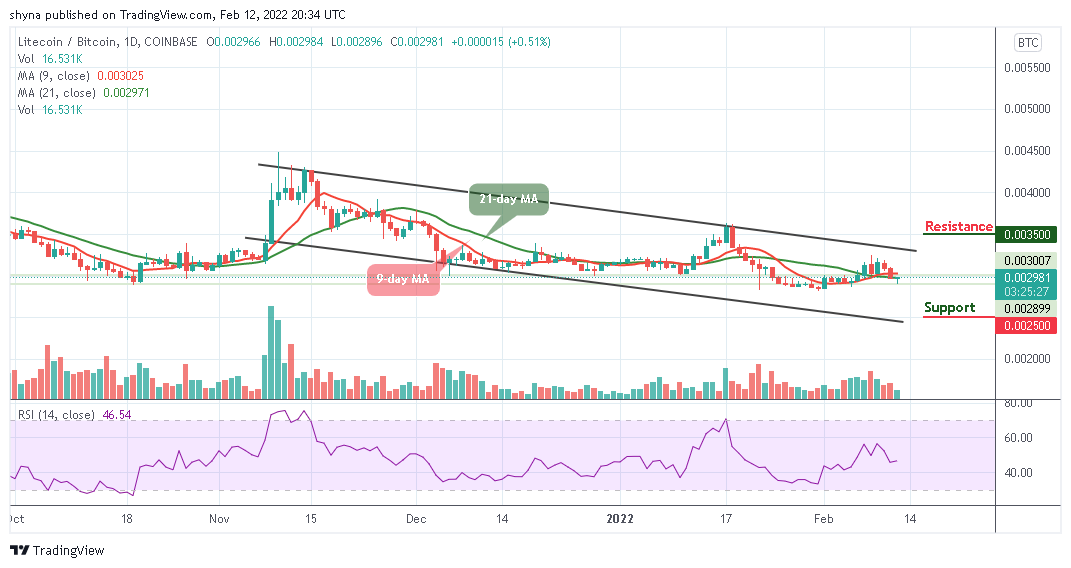
Moreover, if bulls begin to power the market, the coin may likely break above the channel to find the potential resistance level at 3500 SAT and above. Meanwhile, the Litecoin price is currently changing hands to 2981 SAT, and a spike in volatility could occur according to the technical indicator.
Looking to buy or trade Litecoin (LTC) now? Invest at eToro!
68% of retail investor accounts lose money when trading CFDs with this provider
Join Our Telegram channel to stay up to date on breaking news coverage