Join Our Telegram channel to stay up to date on breaking news coverage
LTC Price Prediction – October 31
LTC price experienced rejection above $60 on October 28, after which the coin rapidly pulls back but today the price is going up slowly.
LTC/USD Market
Key Levels:
Resistance levels: $68, $70, $72
Support levels: $50, $48, $46
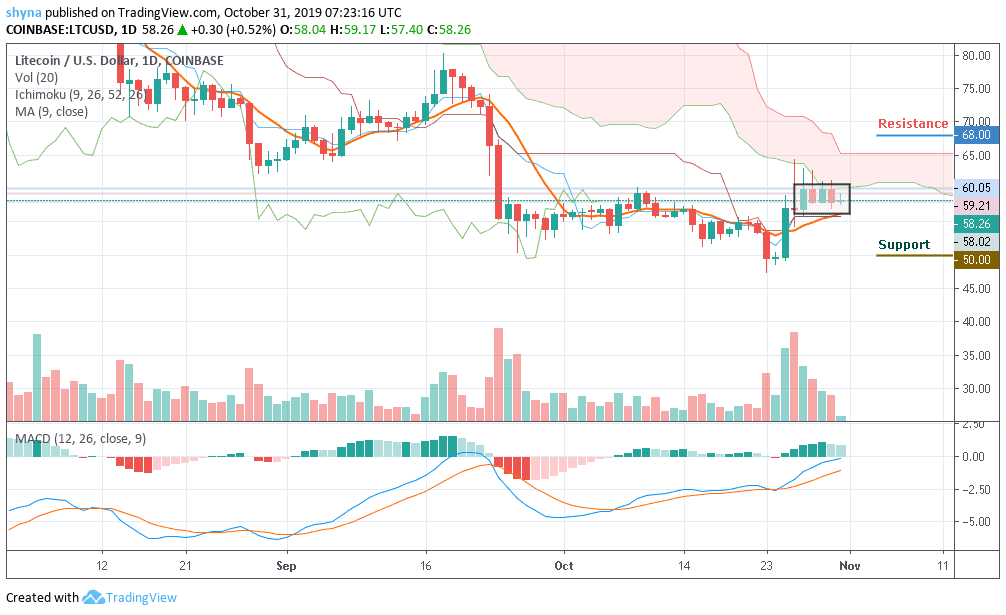
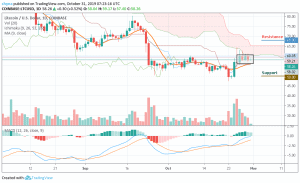
The LTC/USD daily chart is trending in a flag formation. Today, Litecoin has gone up slightly from $58.02 to $58.40. The price is sandwiched between the 9-day moving average and below the red Ichimoku cloud. It looks like LTC/USD is consolidating itself below the $60 level. Yesterday’s price fall for Litecoin took a break on the same day when it could not clear the resistance level above $61.04. The pullback has ushered the coin near $57 against the U.S Dollar recently.
Litecoin price opened at $59.84 yesterday and slowly started an increase tracing a bullish trend line but after touching $61, the price started falling. At the time of writing this article, LTC/USD is changing hands at $58.26. Despite some range-bound trading, the coin still remains under upward movement after a strong buy on October 25.
The market structure has revealed that LTC is still sitting at $58.26. If the price level can hold well, we may see a buyback at $64 resistance before moving up. But as it stands now, the bulls may be looking for close support before climbing higher. However, if the bulls continue above $64, the next level of significant resistance lies at $68, $70 and $72 while the support can be found at $50, $48 and $46. The MACD is still giving some bullish signals which indicate that the bulls are the dominant of the market momentum now.
When compared with Bitcoin, Litecoin has remained fairly static. However, we have seen an increase from 6139 SAT to 6392 SAT today – where resistance was found. The recent increase has also allowed the cryptocurrency to climb close the 9 days moving average which is a promising sign for buyers.
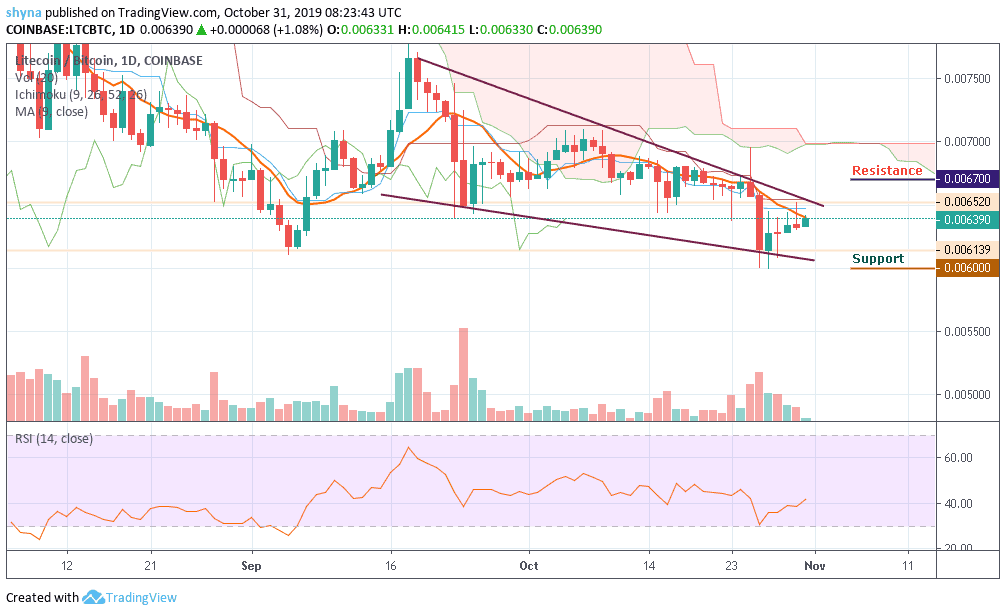
From above, if the bulls can break above 6400 SAT, higher resistance is then located at 6500 SAT. This is then followed with potential resistance levels at 6700 SAT and 6800 SAT. From below, the nearest level of support now lies at 6100 SAT. Beneath this, further support is at 6000 SAT and 5900 SAT respectively. Likewise, the RSI (14) has broken above the 40 level which is a promising sign for the bulls as the momentum is on their side.
Please note: Insidebitcoins.com is not a financial advisor. Do your research before investing your funds in any financial asset or presented product or event. We are not responsible for your investing results.
Join Our Telegram channel to stay up to date on breaking news coverage