Join Our Telegram channel to stay up to date on breaking news coverage
LTC Price Prediction – November 18
The Litecoin price takes a break below $60 and now even $56, forming a descending trend line.
LTC/USD Market
Key Levels:
Resistance levels: $62, $64, $66
Support levels: $50, $48, $46
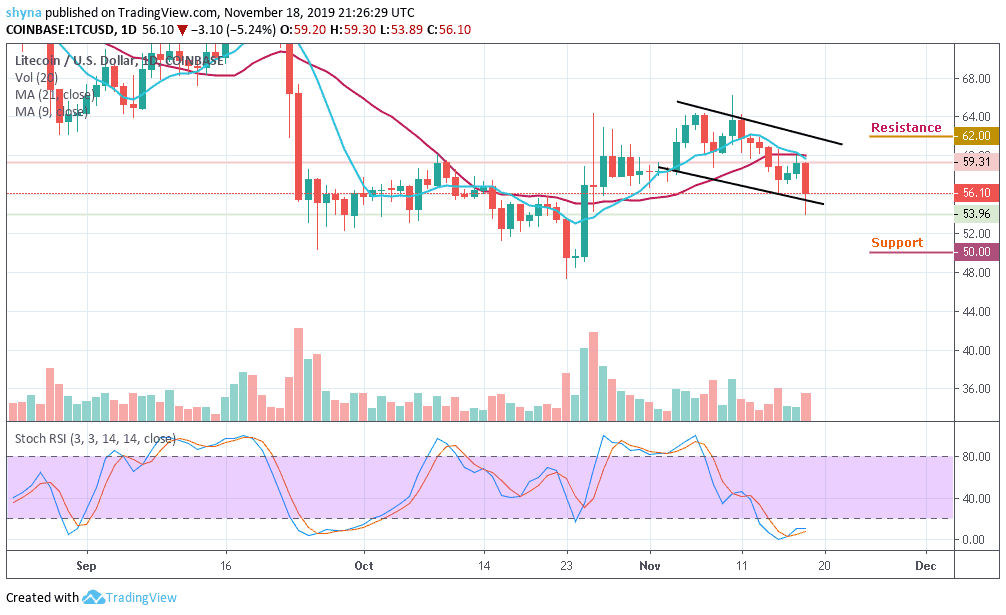
LTC/USD is currently consolidating around the trading range of $55-$59. The trading volume and the market capitalization of the coin also declined sharply. Apart from this, the LTC coin has also lost its position in the global crypto market; from being ranked among the best cryptocurrencies, it now has slipped to the 6th position.
Looking at the movement of LTC/USD, we see that the coin is currently trading at $55.98. The major catch in the trading price has been the lowest in the daily chart, that is, at $53.96; wherein the lower boundary of the channel tightened and led the red candle to have a break below the 9-day and 21-day moving averages.
Nevertheless, the sixth-largest crypto in the world is losing -5.44% of its value as the stochastic RSI is swimming within the oversold zone, which shows that an immense bearish pressure may continue to weigh on the support at $52 and that we could witness further declines at support levels of $50, $48 and $46. Meanwhile, we will need to see a sustainable move above moving averages for the upside to gain traction towards $62, $64 and $66 resistance levels.
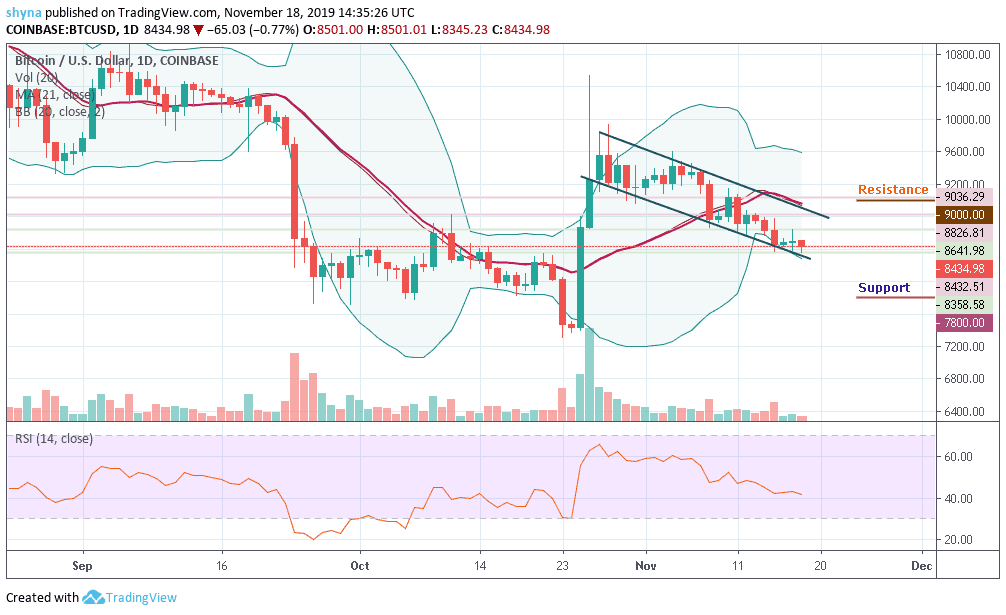
Against Bitcoin, the support level in this range is built around 6600 SAT while the resistance is set at 7100 SAT because the market price has just crossed down the 9-day moving average. Technically, the price started a bullish movement a couple of days ago, and the price moved from 6797 SAT to 6970 SAT but the market has been falling since the beginning of today to 6848 SAT where it’s trading currently.

Furthermore, the stochastic RSI indicator faces downward, indicating that sellers are still at stake. And the bear could signal a downward movement in the long term for the market as soon as the price continues to fall. This feature is essential for markets that run 24/7; many cryptocurrency exchanges lack this type of robustness.More so, the price may swing to the nearest supports at 6400 and below. But the resistance levels to watch are 7200 SAT and above.
Please note: Insidebitcoins.com is not a financial advisor. Do your research before investing your funds in any financial asset or presented product or event. We are not responsible for your investing results.
Join Our Telegram channel to stay up to date on breaking news coverage