Join Our Telegram channel to stay up to date on breaking news coverage
LTC Price Prediction – March 8
LTC/USD price has moved towards the south as the coin falls from its range. It is now trading in the downward, with a loss of 12.93% within 24 hours.
LTC/USD Market
Key Levels:
Resistance levels: $68, $70, $72
Support levels: $44, $42, $40
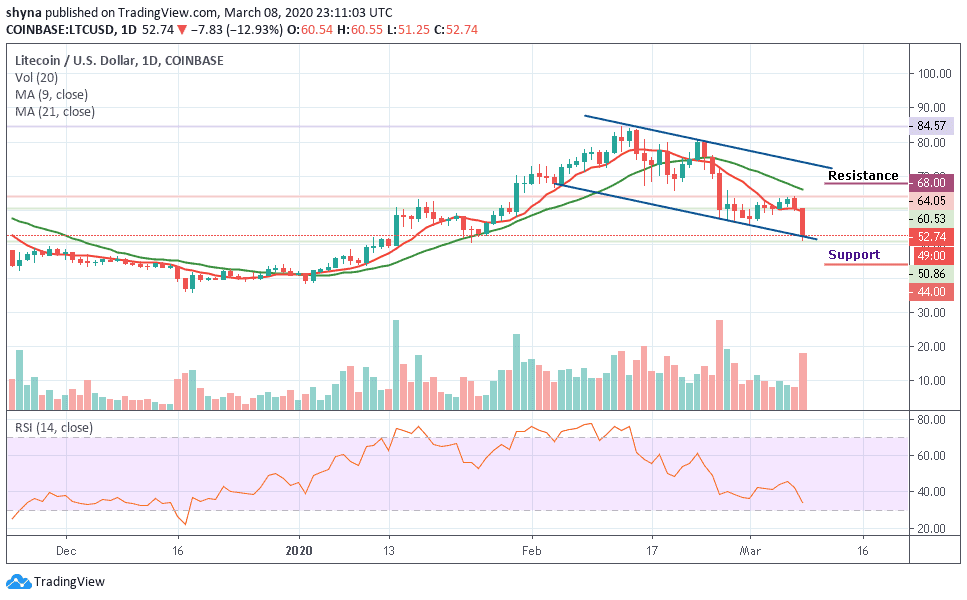
At the opening of the market today, the LTC/USD price was seen following a bearish movement below the 9-day and 21-day moving averages. Meanwhile, LTC/USD could not avoid the bearish wave that ranged the market late last month. This painful downward trend exerted intense pressure on key support established below $80. More so, the declines devastated the support zone and pushed the coin to less than $60.
Looking at the daily chart, we can see that LTC is still sitting at $52.74. If the price level can be maintained, we could consider a buyback with $60 resistance before breaking above the 9-day and 21-day moving averages to reach the resistance levels of $68, $70 and $72. But as it stands now, the bears are making an attempt to visit close supports before climbing higher.
In addition, the Litecoin is still following the downtrend in a descending channel formation, and this shows that the market is still bearish. If the price moves below the lower boundary of the channel, which corresponds to the support at $50, we can expect the LTC market to continue its downward pressure and the price could slip to the critical supports at $44, $42 and $40 respectively as the RSI (14) moves below 35-level, confirming the downward market dynamics.
Against Bitcoin, LTC continues to trend bearishly as the support further outweighs the resistance. In case of a trend reversal, there is a need for an increasing volume and resistance to cause an upsurge in the market. Now, the token is trading around the 6435 SAT below the moving averages. We can expect close support at the 5900 SAT and beyond as the RSI (14) faces the south.
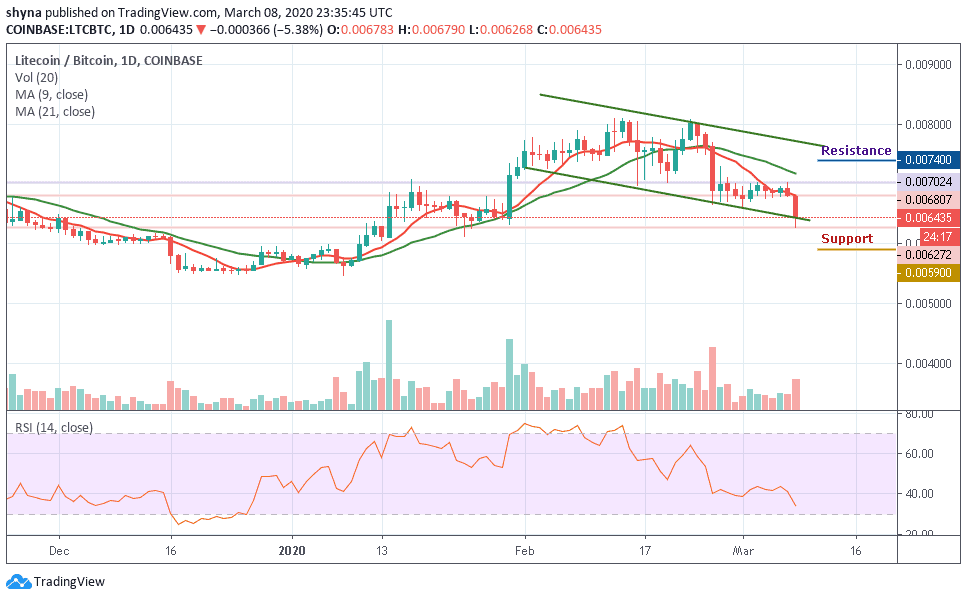
For now, there’s no sign of a bullish movement in the LTC market. However, if a bullish move occurs and validates a break significantly above the 9-day and 21-day moving averages to hit the nearest resistance at 7100 SAT; we can then confirm a bull-run for the LTC/BTC pair. More so, the closest resistance lies at 7400 SAT and 7600 SAT.
Please note: Insidebitcoins.com is not a financial advisor. Do your research before investing your funds in any financial asset or presented product or event. We are not responsible for your investing results.
Join Our Telegram channel to stay up to date on breaking news coverage