Join Our Telegram channel to stay up to date on breaking news coverage
LTC Price Prediction – January 25
LTC/USD plunges towards $50 after failing to sustain gains above $60 while short term analysis puts the bears in charge, meaning Litecoin could welcome the weekend session while in the red.
LTC/USD Market
Key Levels:
Resistance levels: $60, $62, $64
Support levels: $45, $43, $41
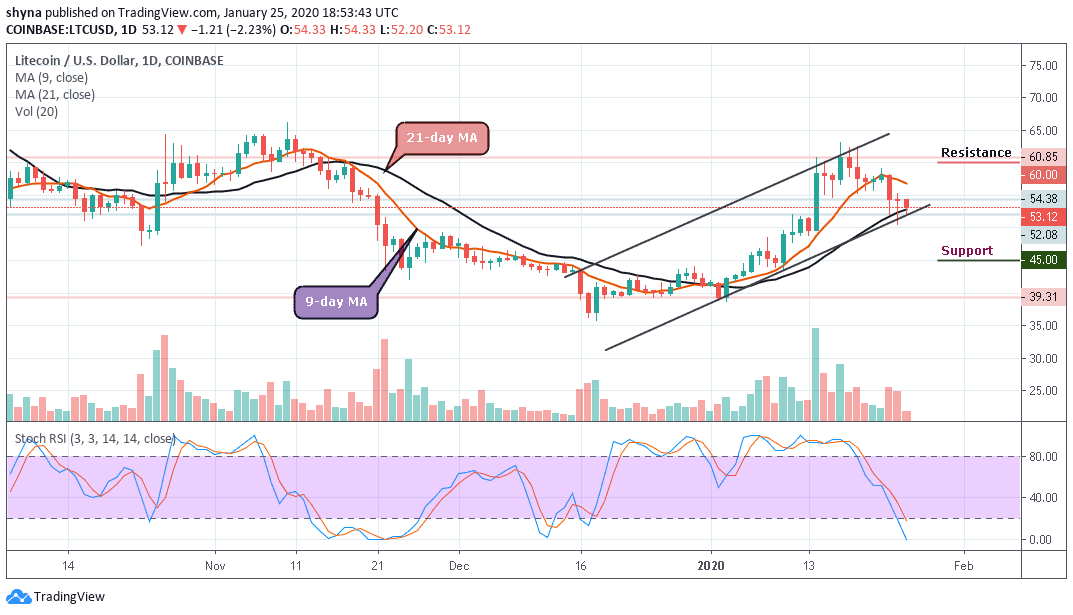
Looking at the daily chart, LTC/USD is still defending the support level of $50 again as the price hovers around $53. The coin is now moving around the 9-day moving average, indicating a bearish movement. For the time being, the market price is moving within the channel and the stochastic RSI indicator may be issuing some bearish signals as it heads towards the oversold zone.
However, looking at the market currently, the LTC/USD is yet to show a strong bear dominance in the long-term. But the short-term outlook looks bullishly strong. However, a bullish interception may set the next key resistance at $60, $62, and $64, crossing the 9-day moving average. Nevertheless, it is possible for the traders to experience a little rise before the rally begins.
Furthermore, following the on-going movement, the price of Litecoin has recently plunged to $52 before a small rise to where it’s currently changing hands at $53.12. A further rally is likely at $45, $43 with a possible new low at $41. As we can see on the daily price chart, LTC volume has been drastically low over the past days, which shows the bears may continue to dominate the market.
Looking at the daily chart, comparing LTC against BTC, the chart reveals that the pair has eventually broken solid support at 6450 SAT. Litecoin price could see another sharp drop at 6100 SAT support level, coming below the 21-day moving average. Breaking this level could further bring the price to the critical support levels at 5900 SAT and 5700 SAT.
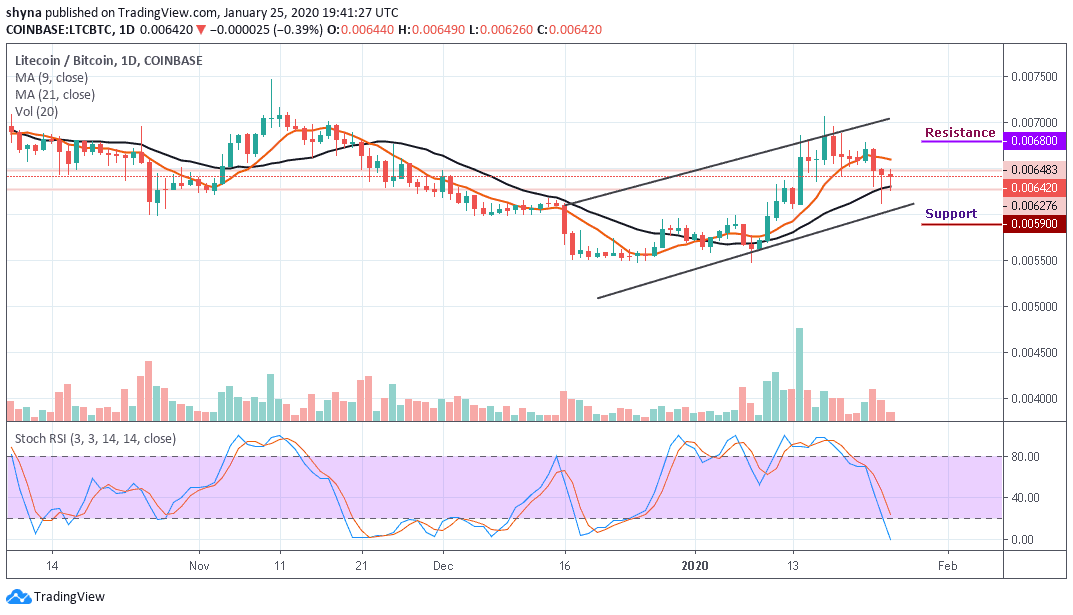
However, the Litecoin price is trading at the 6420 SAT level, if the bulls can hold the price as it is and push the market upward, the next key targets for the bulls lie at 6500 SAT and 6700 SAT respectively. Reaching these levels might take it to the potential resistance levels of 6800 SAT and 7000 SAT. Meanwhile, the stochastic RSI moves to enter into the overbought zone, indicating more bearish movement for the coin.
Please note: Insidebitcoins.com is not a financial advisor. Do your research before investing your funds in any financial asset or presented product or event. We are not responsible for your investing results.
Join Our Telegram channel to stay up to date on breaking news coverage