Join Our Telegram channel to stay up to date on breaking news coverage
LTC Price Prediction – February 15
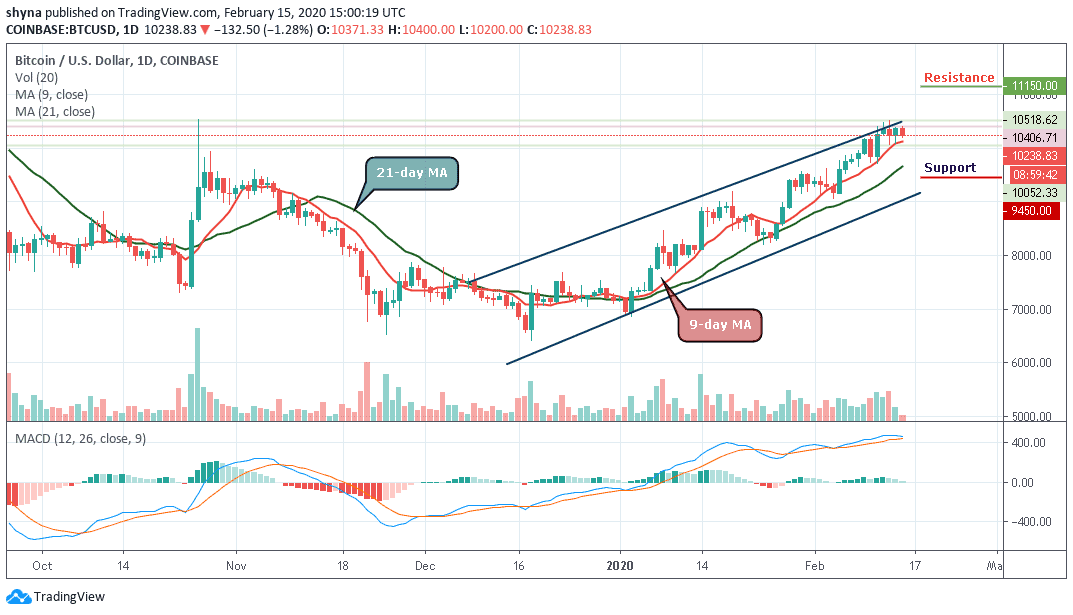
Litecoin (LTC) remains in the bullish hands after the recent reversal embraced support at $78.
LTC/USD Market
Key Levels:
Resistance levels: $92, $94, $96
Support levels: $68, $66, $64
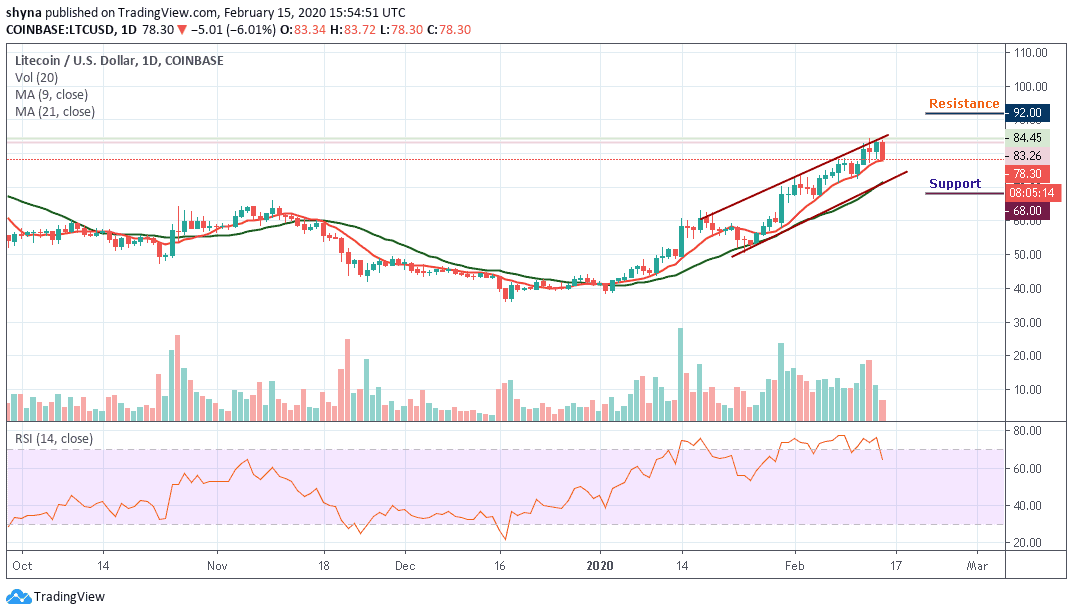
LTC/USD lost over 6% as the market opened today amid global correction on the cryptocurrency market. LTC/USD is changing hands at $78.30, off yesterday’s high registered at $84.45. The coin may settle below the 9-day moving average at $77, which now serves as an initial support level.
However, if the support of $77 gives way, the sell-off may come to focus and it may be extended towards the psychological $74. At the moment, the bearish scenario is even more dominant as sellers continue to post firm commitments. We could see a sharp drop in support of $72 and $70. Breaking the aforementioned supports could further weaken the market to $68, $66 and $64.
In other words, a higher possible swing may likely retest the previous resistance levels at $80 and $85. However, if the bulls manage to fuel the market with the mentioned resistance levels, traders may expect a further increase to $92, $94 and $96 resistance levels. RSI (14) now nosedives to 60-level, indicating the latest selling pressure on the market.
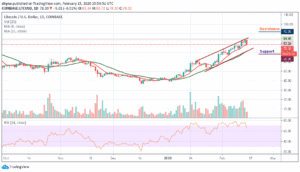
Comparing with Bitcoin, LTC performance has been very low due to a bearish recurring against BTC. The pair has already dropped below the 9-day moving average and it may likely see another sharp drop at 7400 SAT support level. Breaking this level could further drag the market to the nearest support levels at 7200 SAT, 7000 SAT, and 6800 SAT.
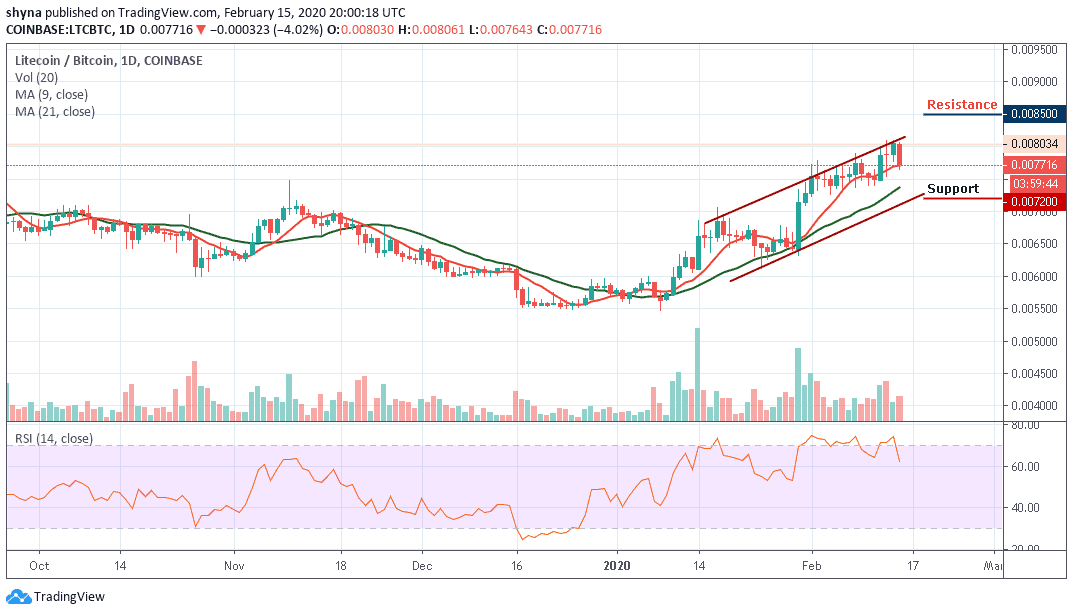
However, LTC/BTC is currently changing hands at 7716 SAT but if the bulls can hold the price tight above the 9-day moving average, the next key target price may likely be at 8000 SAT and 8300 SAT respectively. Reaching these levels might move it to the potential resistance at 8500 SAT and above. Meanwhile, the RSI (14) is dropping towards the 60-level; possible selling pressure is likely if it continues like this.
Please note: Insidebitcoins.com is not a financial advisor. Do your research before investing your funds in any financial asset or presented product or event. We are not responsible for your investing results.
Join Our Telegram channel to stay up to date on breaking news coverage