Join Our Telegram channel to stay up to date on breaking news coverage
LTC Price Prediction – March 9
Litecoin’s price has dropped by 3.75% following the current bearish action in the market.
LTC/USD Market
Key Levels:
Resistance levels: $60, $62, $64
Support levels: $38, $36, $34
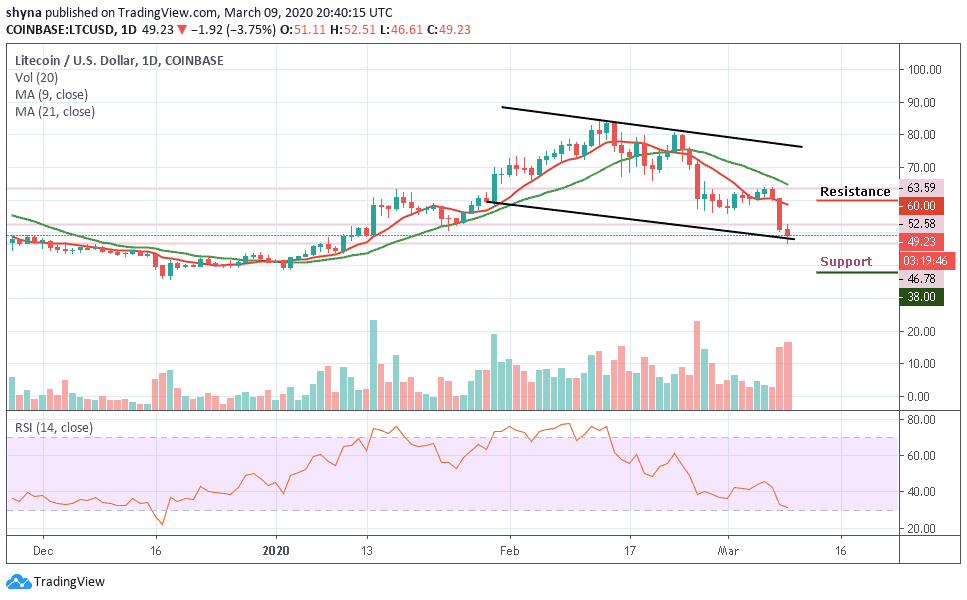
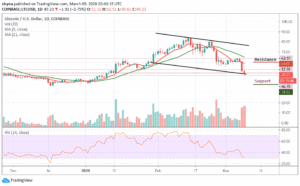
A couple of days ago, LTC/USD recorded some losses in 3 days consecutively. LTC/USD has been on a bearish trend since February 24 as the cryptocurrency made new month low at $46.78. At the time of preparing this article, the Litecoin price is currently trading below the 9-day and 21-day moving averages as the price is about to cross below the lower boundary of the channel.
However, as the coin fails to recover from the current trading levels, the more likely it is that we will see the cryptocurrency fall to a new trading low. A break below the $40 support level may provoke an even deeper decline towards the $38, $36 and $34 levels. The short-term technical analysis shows that the $50 and $52 levels are currently the strongest forms of technical support.
In other words, looking at the daily chart, a break above the $55 level will propel Litecoin to move the nearest resistance level of $58; a further push could take it to a high of $60, $62 and $64 resistance levels. As it stands now, the technical indicator RSI (14) moves toward the south and may likely enter into the oversold zone which may likely cause the market to experience more downward trends.
When compared with BTC, the Litecoin (LTC) has been experiencing a serious downtrend within the channel, especially in the past few days. The coin recently broke under solid support at 6300 SAT and continued to fall through subsequent support level to 6100 SAT. The critical support level is located at the 5500 SAT and below.
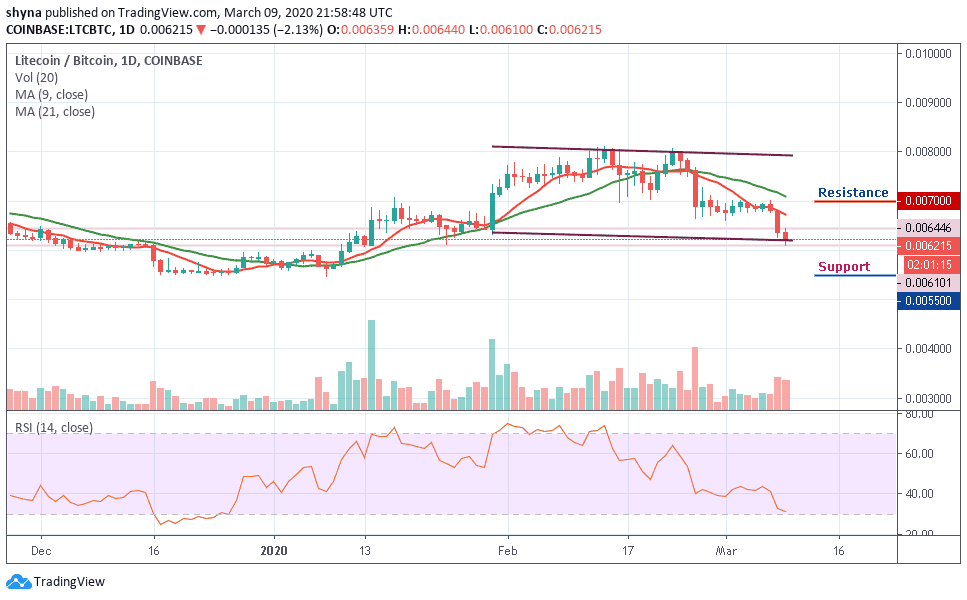
However, if the bulls manage to power the market, we may likely find the resistance level at 7000 SAT and above. Meanwhile, the Litecoin price is currently changing hands at 6215 SAT but a surge in volatility may occur as the RSI (14) moves into the oversold conditions which suggest that more bearish signals may play out.
Please note: Insidebitcoins.com is not a financial advisor. Do your research before investing your funds in any financial asset or presented product or event. We are not responsible for your investing results.
Join Our Telegram channel to stay up to date on breaking news coverage