Join Our Telegram channel to stay up to date on breaking news coverage
LTC Price Prediction – December 28
The Litecoin price is currently changing hands at $43.17 while the RSI (14) indicator moves toward 50-level.
LTC/USD Market
Key Levels:
Resistance levels: $48, $50, $52
Support levels: $36, $34, $32
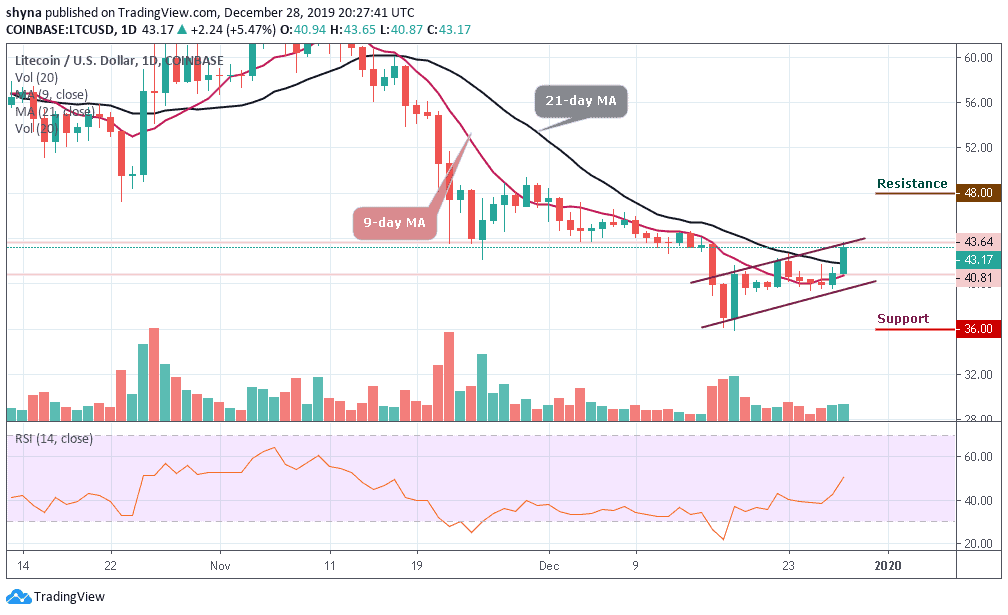
LTC/USD is trading in the green in today’s session, moving within the ascending channel where the coin has gained over 5.10%. LTC/USD bulls broke out from a narrowing range-block formation and move above the 9-day and 21-day moving averages but the price action is capped to the upside at $44 and supported the downside at $40, within tight conditions.
A few days ago, Litecoin (LTC) price was trapped in an incredible nine days narrow trading range after the bullish rally has failed to materialize several times. More so, LTC/USD has failed to clear the hurdles towards the resistance level of $60. Instead, the bears are trying to force their way back to the $52 support level.
However, a break below the $40 support level may provoke an even deeper decline towards the $36, $34 and $32 support levels. Looking at the RSI (14) indicator, LTC/USD may exhibit the tendencies to move higher after the coin ranges for a few days. Meanwhile, as it stands now, the technical indicator may likely aid the movement of the coin to the north.
Moreover, the bulls are making more effort to push the price across the ascending channel, then if this is done, it’s likely for the price to reach the resistance levels of $48, $50 and $52 respectively. The movement above these key resistance levels may encourage further LTC/USD buying.
When compared with Bitcoin, Litecoin (LTC) is making an attempt to cross the upper boundary of the descending channel in other to reach the resistance at 6005 SAT. Unless this resistance is effectively exceeded and the price eventually closes above it, there might not be any reason to expect the long-term bullish reversal.
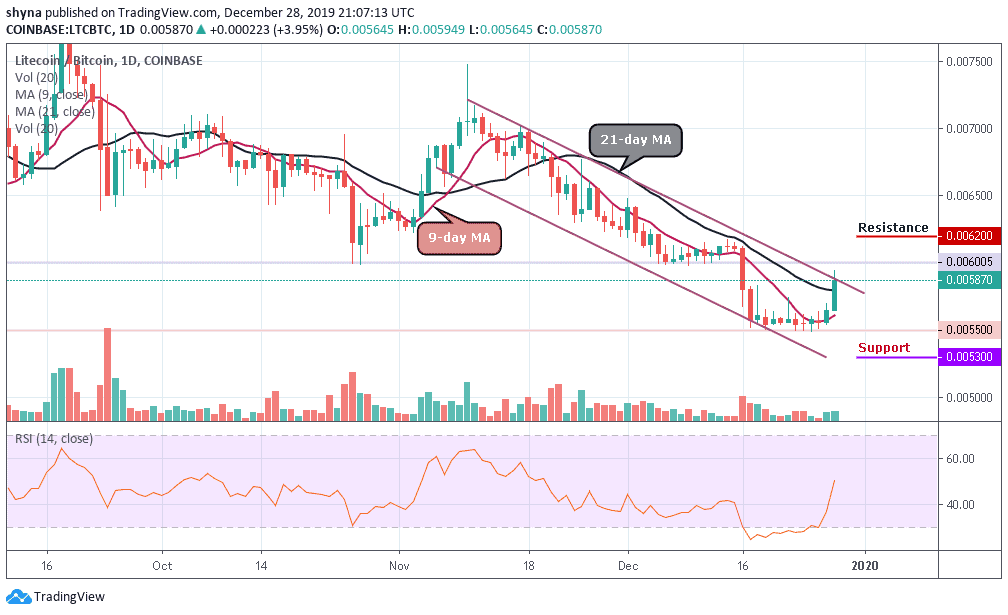
However, trading below the 9-day and 21-day MAs could refresh lows under 5500 SAT and a possible bearish continuation may likely meet the major support at 5300 SAT before falling to 5100 SAT and below while the buyers may push the market to the critical potential resistances at 6200 SAT and above as the RSI (14) indicator faces the north to give more bullish signals.
Please note: Insidebitcoins.com is not a financial advisor. Do your research before investing your funds in any financial asset or presented product or event. We are not responsible for your investing results.
Join Our Telegram channel to stay up to date on breaking news coverage