Join Our Telegram channel to stay up to date on breaking news coverage
Litecoin (LTC) Price Prediction – September 24
The LTC/USD pair is looking for support at $65, where the market is likely to provide a rebound level for the price.
LTC/USD Market
Key Levels:
Resistance levels: $85, $90, $95
Support levels: $55, $50, $45
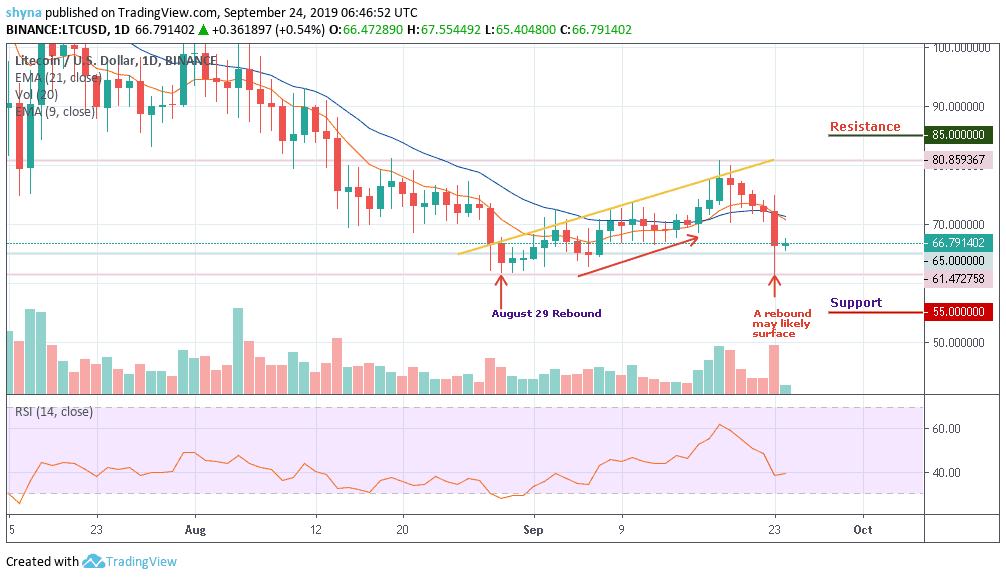
The rebound of August 29 made Litecoin’s price to record a weekly high at $80.85 after relying upon strong support at $61.4. Since September 18, the price of LTC has been trading below $80 due to the recent bearish surge. For this reason, the market has currently dropped by -7.71%, which may become more severe if we see immense selling pressure.
Looking at the market structure, we can see that LTC is still sitting at $66. If the price level can hold well, we may see a buyback at $71 resistance before breaking up the channel to $80 and above. But as it stands now, the bulls are attempting to step back into the market by climbing higher to the potential resistance at $85, $90 and $95 levels.
Meanwhile, considering the latest price drop, the market is likely to fall at $65 and $60 support levels, If the price moves below the mentioned levels, then we can expect the LTC/USD market to continue its bearish pressure while the critical support is expected at $55, $50 and $45 levels. Although the trading volume remains low but has seen a recent increase, the RSI (14) is currently at the 40-level, indicating an indecisive movement in the market.
Against Bitcoin, Litecoin (LTC) is following a bearish formation, and the price is currently sitting on support at 0.0068BTC as it continues to trade in the channel. With volume accumulating on the price chart, the price is likely to fall to 0.0065BTC before testing the 0.0060BTC and 0.0055BTC support levels.
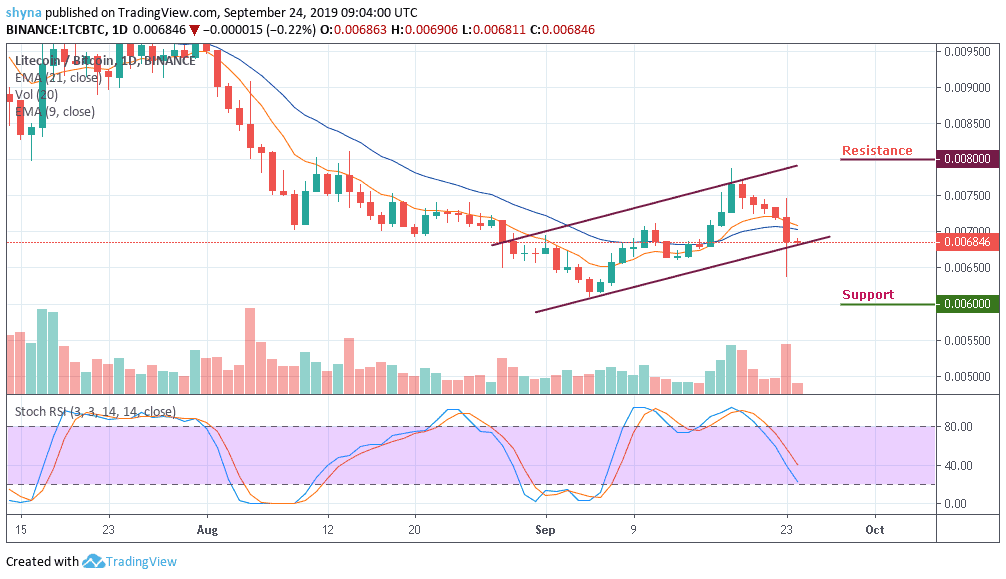
However, if the price rise above the 0.0075BTC resistance level, the token is likely to locate the 0.0080BTC resistance which is close resistance level for the bulls. A bullish continuation could push the market to 0.0085BTC resistance level, testing the upper boundary of the channel. Nevertheless, the trend remains dominant bearish bias on a long-term as stochastic RSI heading to the oversold zone.
Please note: Insidebitcoins.com is not a financial advisor. Do your research before investing your funds in any financial asset or presented product or event. We are not responsible for your investing results.
Join Our Telegram channel to stay up to date on breaking news coverage