Join Our Telegram channel to stay up to date on breaking news coverage
Litecoin (LTC) Price Analysis – September 3
This year has been a good year for Litecoin owners because the coin had soared to $146 just a few months ago. The current performance of the LTC currency market shows that these trends will be repeated very soon.
LTC/USD Market
Key Levels:
Resistance levels: $78, $80, $82
Support levels: $54, $52, $50

The highest Litecoin price recorded in the last 30 days was $105 and, in the last seven days, $74. It is expected that LTC coin may likely trade between these values for most of this month and could trade over them permanently. Although, the price remains low as the trends are positive while the future benefits are assured.
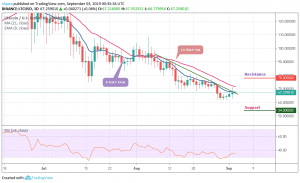
Looking at the price chart, Litecoin price is changing hands at $67.25. However, the coin may exceed the resistance levels of $78, $80 and $82 before the end of the week if bulls make more effort. In other words, if the bulls fail, the token price will resume low as it will still move under the moving averages of 9-day and 21-day with the nearest support levels at $54, $52 and $50 respectively. The RSI (14) is making an attempt to move above level 40, as the bulls push the market upward.
LTC/BTC Market
Against Bitcoin, the daily chart has shown that the sellers are still dominating the market with a heavy surge as the price moves below the moving averages of 9-day and 21-day. For now, the key support level to watch out for lies at 0.0057BTC and 0.0055BTC. A further drop may slip price at 0.0053BTC and below.
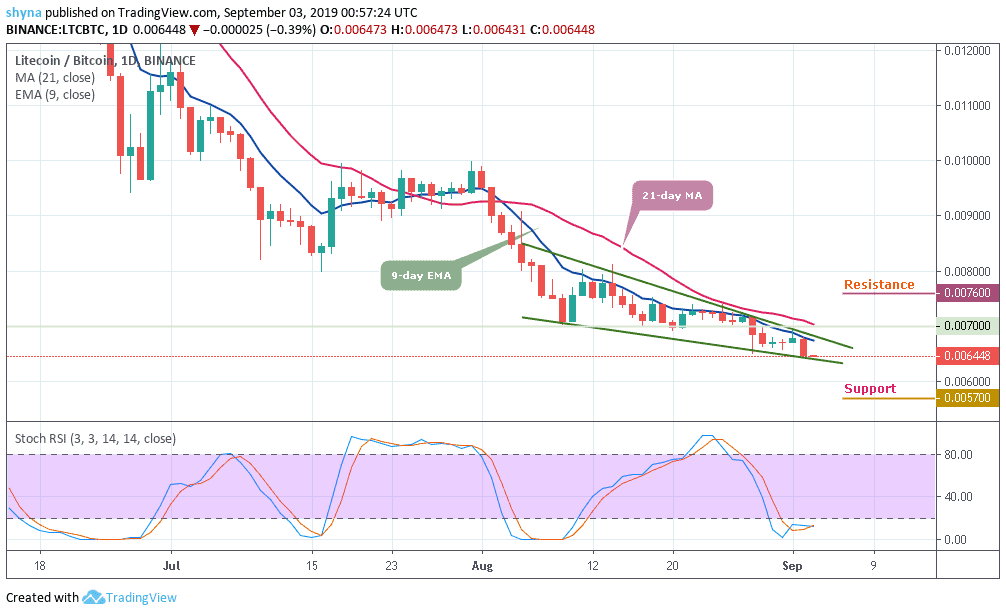
Nevertheless, for a retracement move, the 0.0070BTC resistance is likely to resurface before the rally continues. If the 0.0070BTC could not contain the retracement, the price may further swing to 0.0076BTC, 0.0078BTC and 0.0080BTC resistance levels. The stochastic RSI keeps swimming in the oversold territory, which could generate more bearish signals.
Please note: Insidebitcoins.com is not a financial advisor. Do your research before investing your funds in any financial asset or presented product or event. We are not responsible for your investing results.
Join Our Telegram channel to stay up to date on breaking news coverage