Join Our Telegram channel to stay up to date on breaking news coverage
USDCAD Price Analysis – April 25
Yesterday, former supply level of $1.3472 was penetrated upside by the bulls’ pressure. Today’s daily candle is bullish pushing the currency pair towards $1.3648. There is a possibility that the Bulls will push the currency pair up to the $1.3648 level since it has broken up the barrier at $1.3472 level.
USD/CAD Market
Key levels:
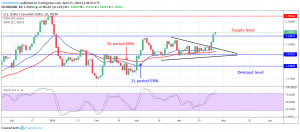
Supply levels: $1.3648, $1.3845, $1.4025
Demand levels: $1.3472, $1.3312, $1.3207
USDCAD Long-term trend: Bullish
USDCAD resumed uptrend movement on the long-term outlook. The Bulls defended the demand level of $1.3312 and there was a bullish breakout at the upper trend line on April 23 with the formation of the strong bullish candle. The bullish momentum extended to the former supply level of $1.3472. Yesterday, the just mentioned level was penetrated upside by the bulls’ pressure. Today’s daily candle is bullish pushing the USDCAD price towards $1.3648.

The 21 EMA is already above the 50 EMAs and the USDCAD is trading above the two EMAs which connotes that the Bulls are in control of the USDCAD market. The Stochastic Oscillator period 14 is above 75 levels and the signal lines are pointing to the north which indicates a further increase in USDCAD price. There is a possibility that the Bulls will push the currency pair up to the $1.3648 level since it has broken up the barrier at $1.3472 level.
USDCAD medium-term Trend: Bullish
USDCAD is on the strong bullish trend on the medium-term outlook. The Bulls’ momentum on the 4-hour chart is rapidly increasing immediately it broke out from the upper trend line of the symmetrical triangle formed last week. There may be a price pullback as the trend increases.

The 21 periods EMA and 50 periods EMA is directly pointing upward with the price trading far above the two EMAs. The Stochastic Oscillator period 14 is above 75 levels and the signal lines pointing upward to indicate buy signal and further inclination of USDCAD price.
Please note: insidebitcoins.com is not a financial advisor. Do your own research before investing your funds in any financial asset or presented product or event. We are not responsible for your investing results.
Join Our Telegram channel to stay up to date on breaking news coverage