Join Our Telegram channel to stay up to date on breaking news coverage
AUDJPY Price Analysis – May 31
AUDJPY is targeting the demand level of $73 and this can be achieved only when the Bears further exert more pressure in the AUDJPY market. Should the $73 level does not hold, the bearish momentum may extend to $70 level.
AUD/JPY Market
Key levels:
Supply levels: $75, $77, $79
Demand levels: $73, $70. $$66
AUDJPY Long-term trend: Bearish
AUDJPY maintains its bearish trend on the long-term outlook. Last week, the Bears’ momentum and the Bulls’ pressure were weak on the daily chart. That was what led to the price consolidation at $75 price level. Yesterday’s market was closed with a daily Doji candle. Today, the Bears gained enough pressure and a bearish candle emerged that penetrates the $75 level downside and the pair is currently exposed to the $73 demand level.
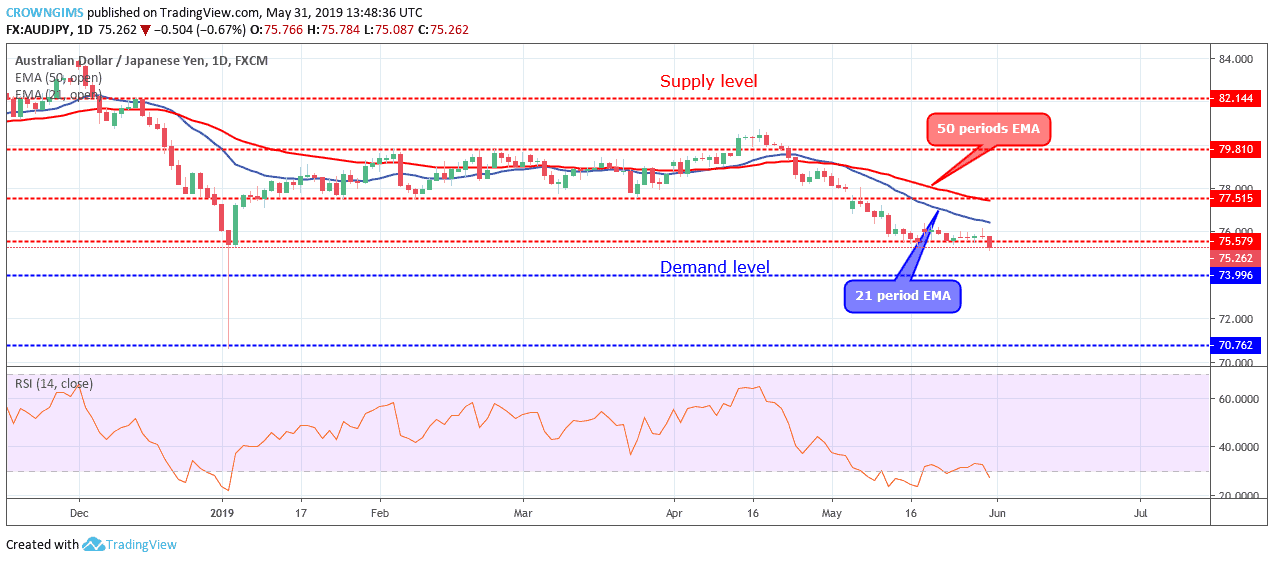
The Relative Strength Index period 14 is below 30 levels with the signal line pointing down to indicate a further decrease in the price of AUDJPY. The currency pair continues its trade below 21 periods EMA and 50 periods EMA. The gap between the two EMAs is increasing which connotes increase in the bearish momentum. AUDJPY is targeting the demand level of $73 and this can be achieved only when the Bears further exert more pressure in the AUDJPY market. Should the $73 level does not hold, the bearish momentum may extend to $70 level. In case the $73 level holds, the price may reverse at the level
AUDJPY medium-term Trend: Bearish
AUDJPY is still bearish on the medium-term outlook. The currency pair engaged on the ranging movement at $75 price level last week. The pair was trading on and around the two EMAs as a sign of consolidation. Today, the Bears’ momentum increased and the $75 price level was penetrated downside. The price may carry out a retest to the broken level.
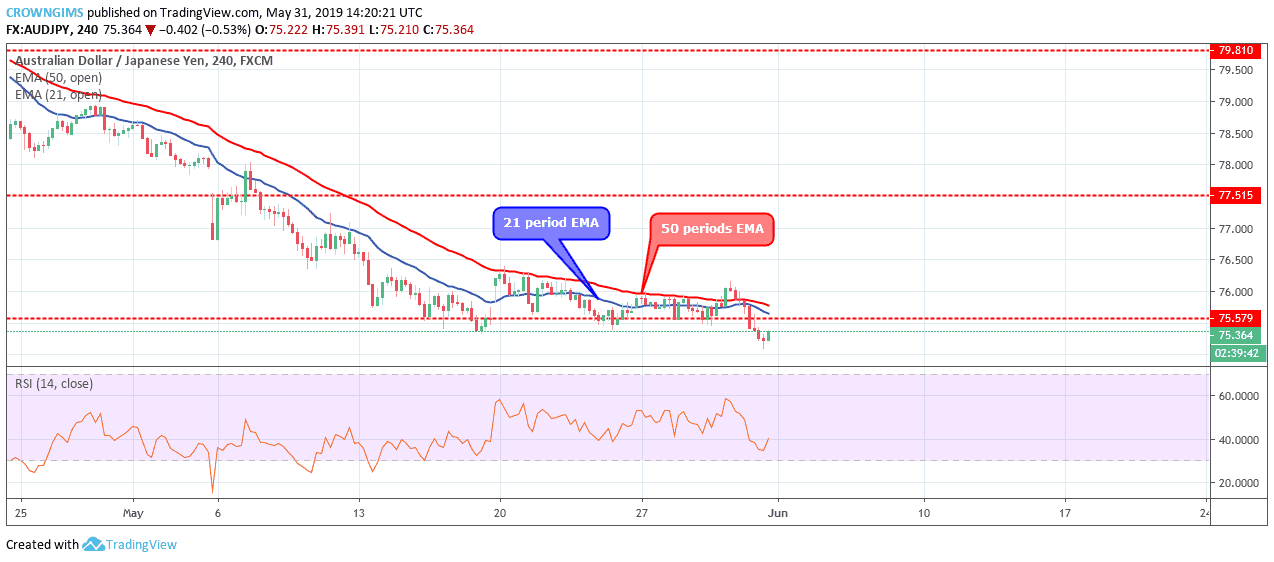
As at the moment, the pair remains under the two EMAs. However, the Relative Strength Index period 14 is at 40 levels with the signal line points up to indicate buy signal which may be a pullback.
Please note: insidebitcoins.com is not a financial advisor. Do your own research before investing your funds in any financial asset or presented product or event. We are not responsible for your investing results.
Join Our Telegram channel to stay up to date on breaking news coverage