Join Our Telegram channel to stay up to date on breaking news coverage
ETH Price Prediction – December 31
The price of Ethereum (ETH) is approaching a crucial support level, similar to Bitcoin. The Ethereum price must hold the $125 support to climb towards $140.
ETH/USD Market
Key Levels:
Resistance levels: $140, $150, $160
Support levels: $120, $110, $100
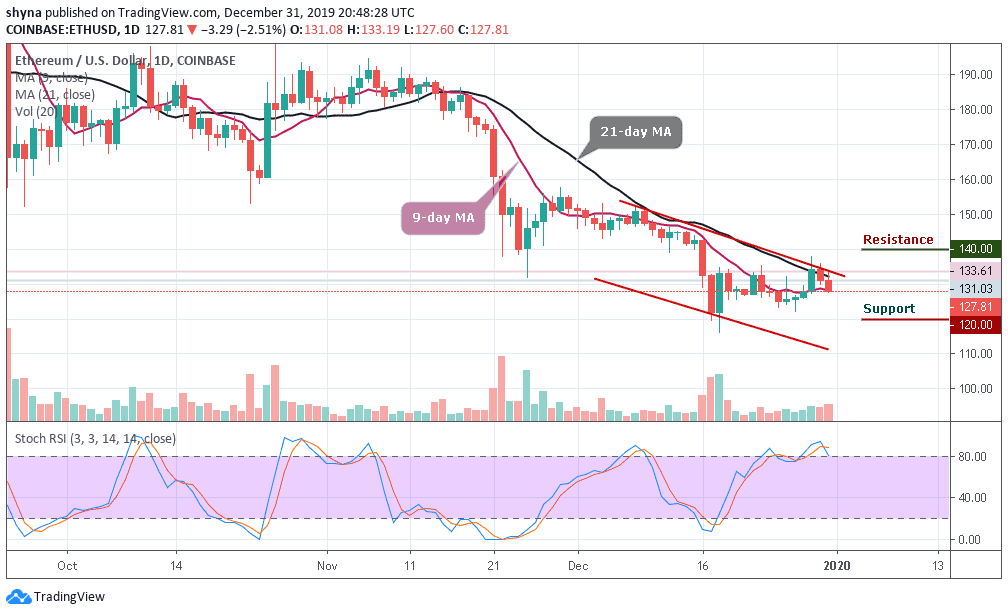
At the time of writing, ETH/USD is trading down 2.51% at its current price of $127.81, which marks a notable decline from its daily highs of $131.03 that was set today when the bulls attempted to spark another rally. In the near-term, ETH/USD has been able to find some support in the lower $126 level, as it has bounced multiple times after visiting these levels.
The price of the Ethereum was bitten today by the bear. ETH/USD is currently experiencing a price drop. Many traders were expecting a lot from the coin, although December 28 and 29 reflected an improvement in ETH prices while both the Ethereum and Bitcoin started trading with a fall today. The price is currently moving under the 9-day and 21-day moving averages but yet to break out to the upside or downside of the channel.
Moreover, a bearish drop may roll the market down to the support level of $120, $110 and $100 while possible bullish surge may drive the market above the 9-day moving average to $135 level, while testing the upper channel boundary, the $140, $150 and $160 may further provide resistance levels for the market. The RSI (14) is at the overbought zone and staying there would cause the coin to remain below the $130 support level.
When compared with Bitcoin, the market price remained in the descending channel but the bears are trying to step back into the market again. ETH/BTC is currently trading at the 1817 SAT and the bulls couldn’t push the price to cross the 21-day MA. Looking at the chart, if the market continues to drop, the next key supports may likely be at 1700 SAT and below.
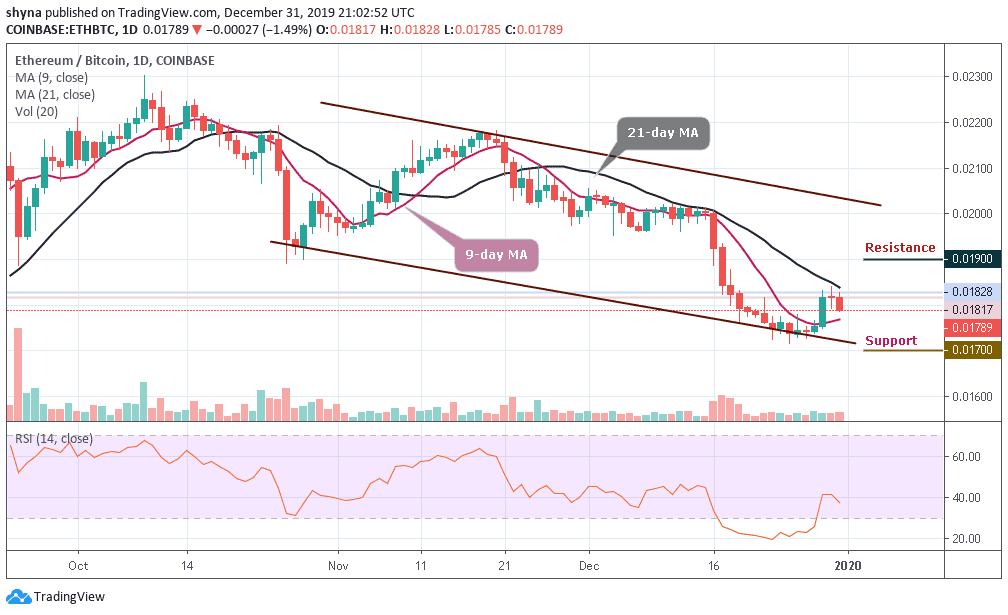
However, on the upside, a possible bullish movement may likely push the market above the moving average of 21 days, when this is done, the resistance level of 1900 SAT and above could be visited. Meanwhile, the RSI (14) indicator moves below 40-level, which indicates that the market may continue to fall.
Please note: Insidebitcoins.com is not a financial advisor. Do your research before investing your funds in any financial asset or presented product or event. We are not responsible for your investing results.
Join Our Telegram channel to stay up to date on breaking news coverage