Join Our Telegram channel to stay up to date on breaking news coverage
ETH Price Prediction – September 26
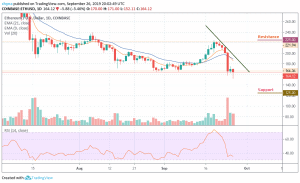
Ethereum loses more than 4% overnight to go as low as $163; the next support may come at $140.
ETH/USD Market
Key Levels:
Resistance levels: $225, $235, $245
Support levels: $125, $115, $105
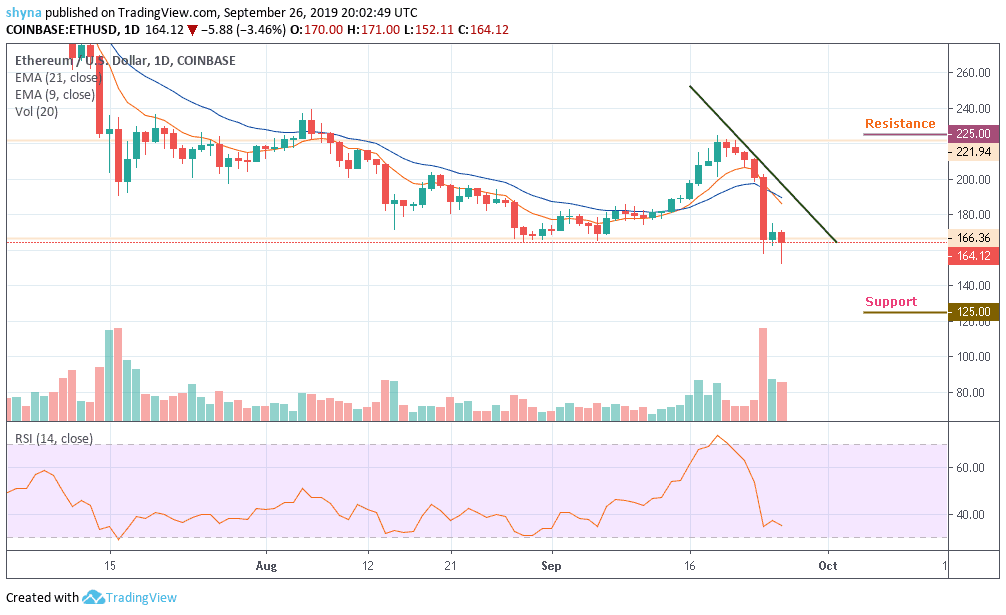
The second cryptocurrency in the global market, with a market capitalization of $17.7 billion, has been moving in a downward trend from the recent high that reached $221.94 since the beginning of the month. At the time of writing, the ETH/USD is hovering around $164.12. This amount has been fluctuating since the beginning of the day and is -2.87% lower than that of yesterday.
Ethereum struggled last week and traded above the 9-day and 21-day moving averages, but after the success of the pair’s deal on September 19, the coin fell sharply, which has reduced its price to $164.12, where it is currently trading. ETH/USD has been trading below the moving averages, but any crossover above the green-line could push the price to the nearest resistance level of $200. More so, the other resistances to watch are $225, $235 and $245 levels.
However, if the coin falls below $150, ETH/USD would continue to show low prices and fall to the support levels of $125, $115 and $105, until the market finds a stable level to reinforce the uptrend. But for the moment, a new low is yet to be determined as the bears remain dominant and active during the last 7 days trading. The buyers may have to wait until the sellers exhaust their momentum before longing. However, the RSI (14) drops below level 40 to show that the bulls may soon return to the market.
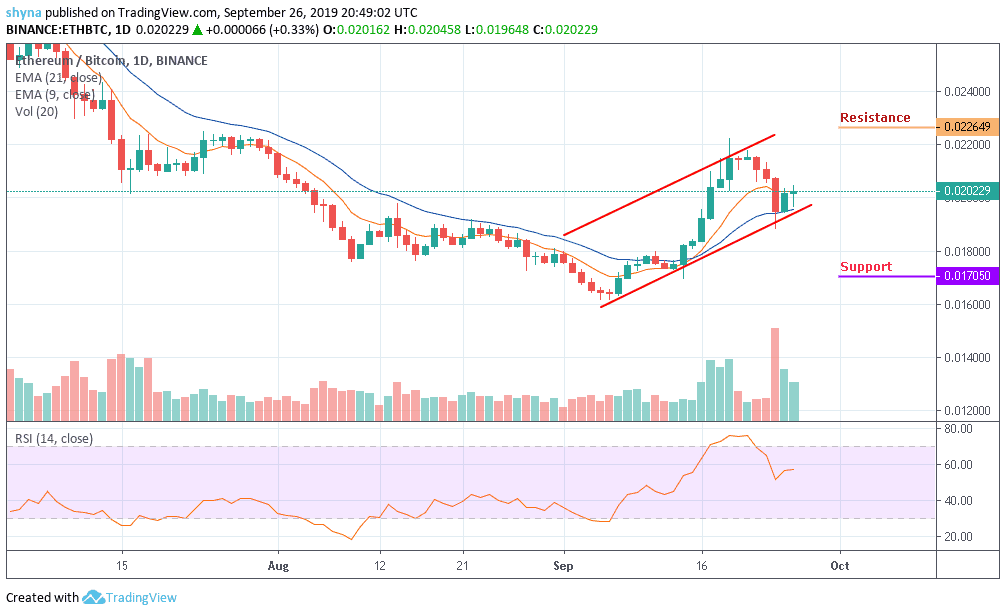
Looking at the ETH/BTC daily chart, Ethereum continued to trade above the moving averages and is now trading at 0.0202 BTC. The pair seems to be moving towards the nearest resistance levels of 0.0226 BTC and 0.0240 BTC. But should it move inversely to the lower side of the channel, the closest supports are at 0.0170 BTC and 0.0160 BTC. The RSI has just moved away from level 50 and is on the rise, which could indicate a gradual return of the bulls.
Please note: Insidebitcoins.com is not a financial advisor. Do your research before investing your funds in any financial asset or presented product or event. We are not responsible for your investing results.
Join Our Telegram channel to stay up to date on breaking news coverage