Join Our Telegram channel to stay up to date on breaking news coverage
ETH Price Prediction – January 19
The price of Ethereum may likely show more bearish signs in the coming week but the bulls seem to be sitting on the sidelines for the moment.
ETH/USD Market
Key Levels:
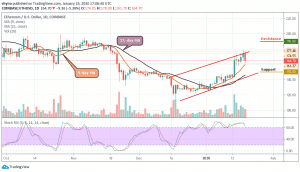
Resistance levels: $190, $195, $200
Support levels: $150, $145 $140

At the moment, ETH/USD is been bitten by the bear. The coin is currently experiencing a price drop and traders were still expecting a lot from the coin, although from January 3 up till yesterday, the coin has reflected an improvement in prices. Actually, both Ethereum and Bitcoin started with a drop today.
In addition, the Ethereum (ETH) price is moving above the 9-day and 21-day moving averages, exchanging hands at $164.70 which is yet to break out above the ascending channel. The continuation of the bearish drop may roll the market down below the moving averages and also to the support levels of $150, $145 and $140.
More so, a possible bullish surge may drive the market to $175 level, testing the upper channel boundary. Above the channel, $190, $195 and $200 may further provide resistance levels for the market. The stochastic RSI is currently sitting within the overbought zone and leaving there could cause the coin to drop below the moving averages.
When compared with BTC, Ethereum (ETH) is currently changing hands at 0.0190 BTC following a heavy bearish moment at the time the market opens today. Looking at the daily chart, the current trend of the coin is perpetually looking bullish in the short-term, moving above the 9-day and 21-day moving averages within the descending channel.
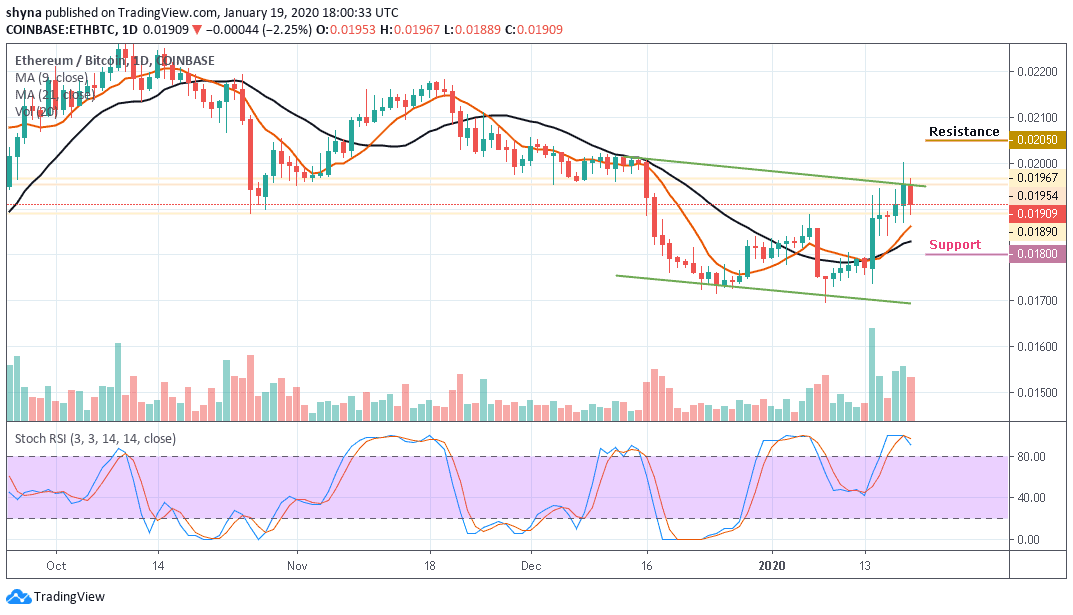
Meanwhile, the resistance levels to look for are 0.0205 BTC and 0.0210 BTC while the closest support levels to keep an eye on are 0.0180 BTC and critically 0.1805 BTC. The stochastic RSI is moving within the overbought zone, which could start giving bearish signals in the nearest term.
Please note: Insidebitcoins.com is not a financial advisor. Do your research before investing your funds in any financial asset or presented product or event. We are not responsible for your investing results.
Join Our Telegram channel to stay up to date on breaking news coverage