Join Our Telegram channel to stay up to date on breaking news coverage
ETH Price Prediction – March 11
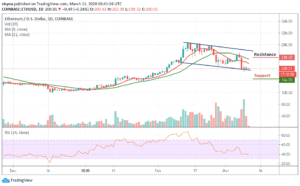
Ethereum saw a 0.24% price fall within the few hours of trading as it drops back toward $190.
ETH/USD Market
Key Levels:
Resistance levels: $238, $248, $258
Support levels: $166, $156, $146

ETH/USD is flirting with $200 following a rejection at $208.36 on Tuesday. The price action at $200 level speaks of the indecision in the market. However, ETH/USD downside is still holding above a key ascending trend line. The prevailing trend suggests that the sideways action could take center stage in the coming sessions as the coin trades below the 9-day and 21-day moving averages.
The cryptocurrency would now need to rise and break above $220 before resuming the previous bullish trend and would still need to break beneath the lower boundary of the channel at $190 before turning bearish. If the sellers push lower, we can expect very strong support at $180; this is then followed up with support at $170. If the bears push further below $170, support is then located at $166, $156 and $146.
On the other hand, if the buyers regroup and rebound from $200, the first level of resistance lies at $230. This is then followed with resistance at $238, $248 and $258 while the RSI (14) is at the 40-level to indicate indecision within the market. If the technical indicator dips beneath 40, we can expect ETH/USD to head lower beneath $200 and possibly toward $190.
Against Bitcoin, the Ethereum price keeps following the downward trend within the channel as the bears are still dominating the market. ETH/BTC is currently trading at 0.0253 BTC and the bulls couldn’t push the price to the north. Looking at the chart, if the price continues to drop, the next key supports may likely be at 0.0235 BTC and beyond.
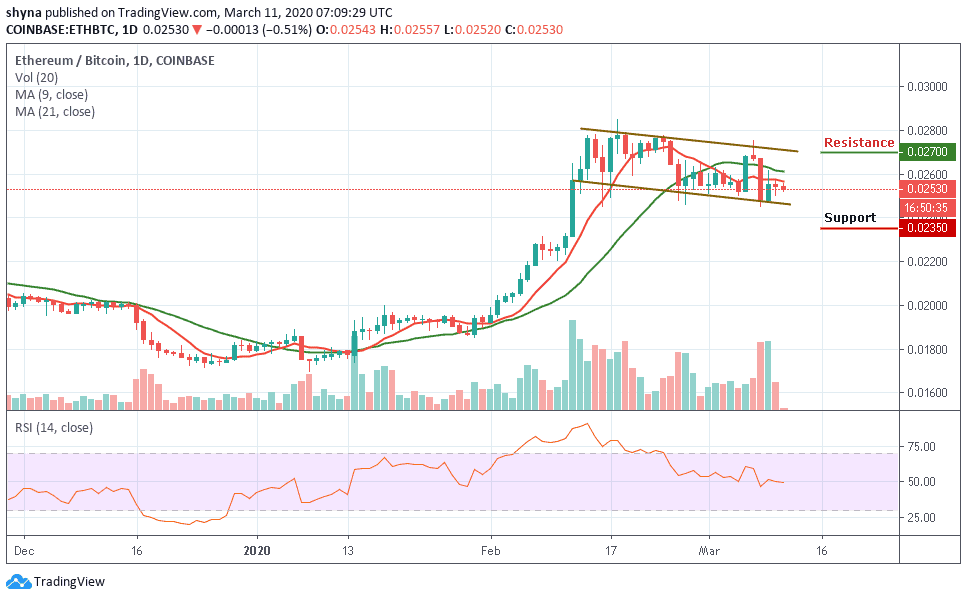
In other words, a possible bullish movement could push the market towards the moving averages of 9-day and 21-day within the channel, a break above this may enable ETH to reach a high of 0.0270 BTC and above but the RSI (14) is moving around 50-level, which shows that the market might experience a sideways movement.
Please note: Insidebitcoins.com is not a financial advisor. Do your research before investing your funds in any financial asset or presented product or event. We are not responsible for your investing results.
Join Our Telegram channel to stay up to date on breaking news coverage